


See why hundreds of industry leaders trust Secoda to unlock their data's full potential.
 Get the guide
As data volumes grow and pipelines become more distributed, data observability tools have become essential for preventing broken dashboards, failed models, and costly business decisions. In 2025, the best data observability tools help teams monitor data quality, catch anomalies, trace lineage, and reduce time-to-resolution when issues arise. This guide highlights top solutions from AI-powered observability platforms to lightweight, open-source frameworks. Whether you’re focused on proactive monitoring, real-time alerting, or integrated governance, this list will help you choose the right fit for your modern data stack.
What are data observability tools?
Data observability tools give teams a clear, continuous view of their data's health. They monitor pipelines for anomalies, schema changes, missing records, and unexpected trends, helping you catch issues early before they impact downstream dashboards, models, or business decisions.
These tools go beyond checking for broken data. Many now include insights into pipeline performance, latency, and cost, so you can identify bottlenecks and areas for optimization. The result is greater confidence in your data and better context for decision-making.
If you're managing a modern data stack, a good observability tool is foundational. In this article, we’ll walk through the most widely used tools today to help you find the right fit for your team.
How to choose the right data observability tool for your company
Now we know that data observability tools are essential for data teams who need to quickly and accurately assess the performance of their systems. With the right tool, you can gain better visibility into your data, reduce downtime, improve accuracy and prevent potential issues before they arise.
Still, choosing the right tool takes careful consideration. When selecting a data observability tool, there are several factors to consider, such as:
- Telemetry data — Does the data tool offer the features you need to track the telemetry data you need? Your data observability tool should be well-suited to tracking metrics, logs and traces across your systems.
- Scalability — The scalability of the data observability tool is also important. As your data infrastructure grows over time, your observability tools should be able to keep pace.
- Features — Features are another important part of your decision. Does it include alerting, dashboards or other advanced features? You may want to speak with your data team to see what features they consider important in an observability tool.
- Budget — Consider the cost of the data observability tool. There are open-source options and cost-effective options, but some enterprise-level solutions can be expensive. However, these enterprise-level options may be necessary for what you need. Make sure you weigh the costs with the opportunities the tool provides before making your decisions.
- Stakeholders — Finally, consider the stakeholders in the decision. Who will be using the tool the most? Getting their input is important to see if it’s worth investing time and resources into a new tool.
Choosing the right data observability tool for your business can be a complex process, but it’s essential to ensure that your data and systems are running smoothly. By taking into account these factors, you can make the best decision possible for your organization.
Key features you want in your next observability tool
Choosing the right data observability tool is crucial for ensuring data reliability and maintaining system performance. Here are the key features to look for when evaluating your options:
1. Automated anomaly detection
A strong data observability tool should automatically identify anomalies such as missing data, schema drift, or unexpected changes in trends. Real-time anomaly detection helps teams catch and resolve issues before they impact business operations.
2. End-to-end data lineage
Understanding how data moves through your systems is essential for troubleshooting and governance. Look for a tool that provides detailed data lineage tracking, showing the full journey of data from source to destination.
3. Real-time monitoring & alerts
Your observability tool should offer continuous monitoring and proactive alerts for data quality issues, pipeline failures, and system performance bottlenecks. Customizable alerting ensures teams can respond quickly to critical issues.
4. Root cause analysis & troubleshooting
Identifying the source of data issues can be time-consuming. A robust observability tool should provide root cause analysis features, helping teams diagnose problems efficiently and prevent recurring issues.
5. Scalability & performance optimization
As data volumes grow, your observability solution must scale accordingly. Ensure the tool can handle large datasets, complex pipelines, and distributed environments without compromising performance.
6. Compliance & governance support
Organizations handling sensitive data need observability tools that support governance frameworks. Features like audit logs, access controls, and compliance tracking ensure regulatory adherence and data security.
7. Integration with your data stack
Your observability tool should seamlessly integrate with your existing data ecosystem, including databases, ETL tools, cloud platforms, and BI solutions. A tool with broad compatibility ensures smoother implementation and minimal disruption.
Top data observability tools
1. Secoda

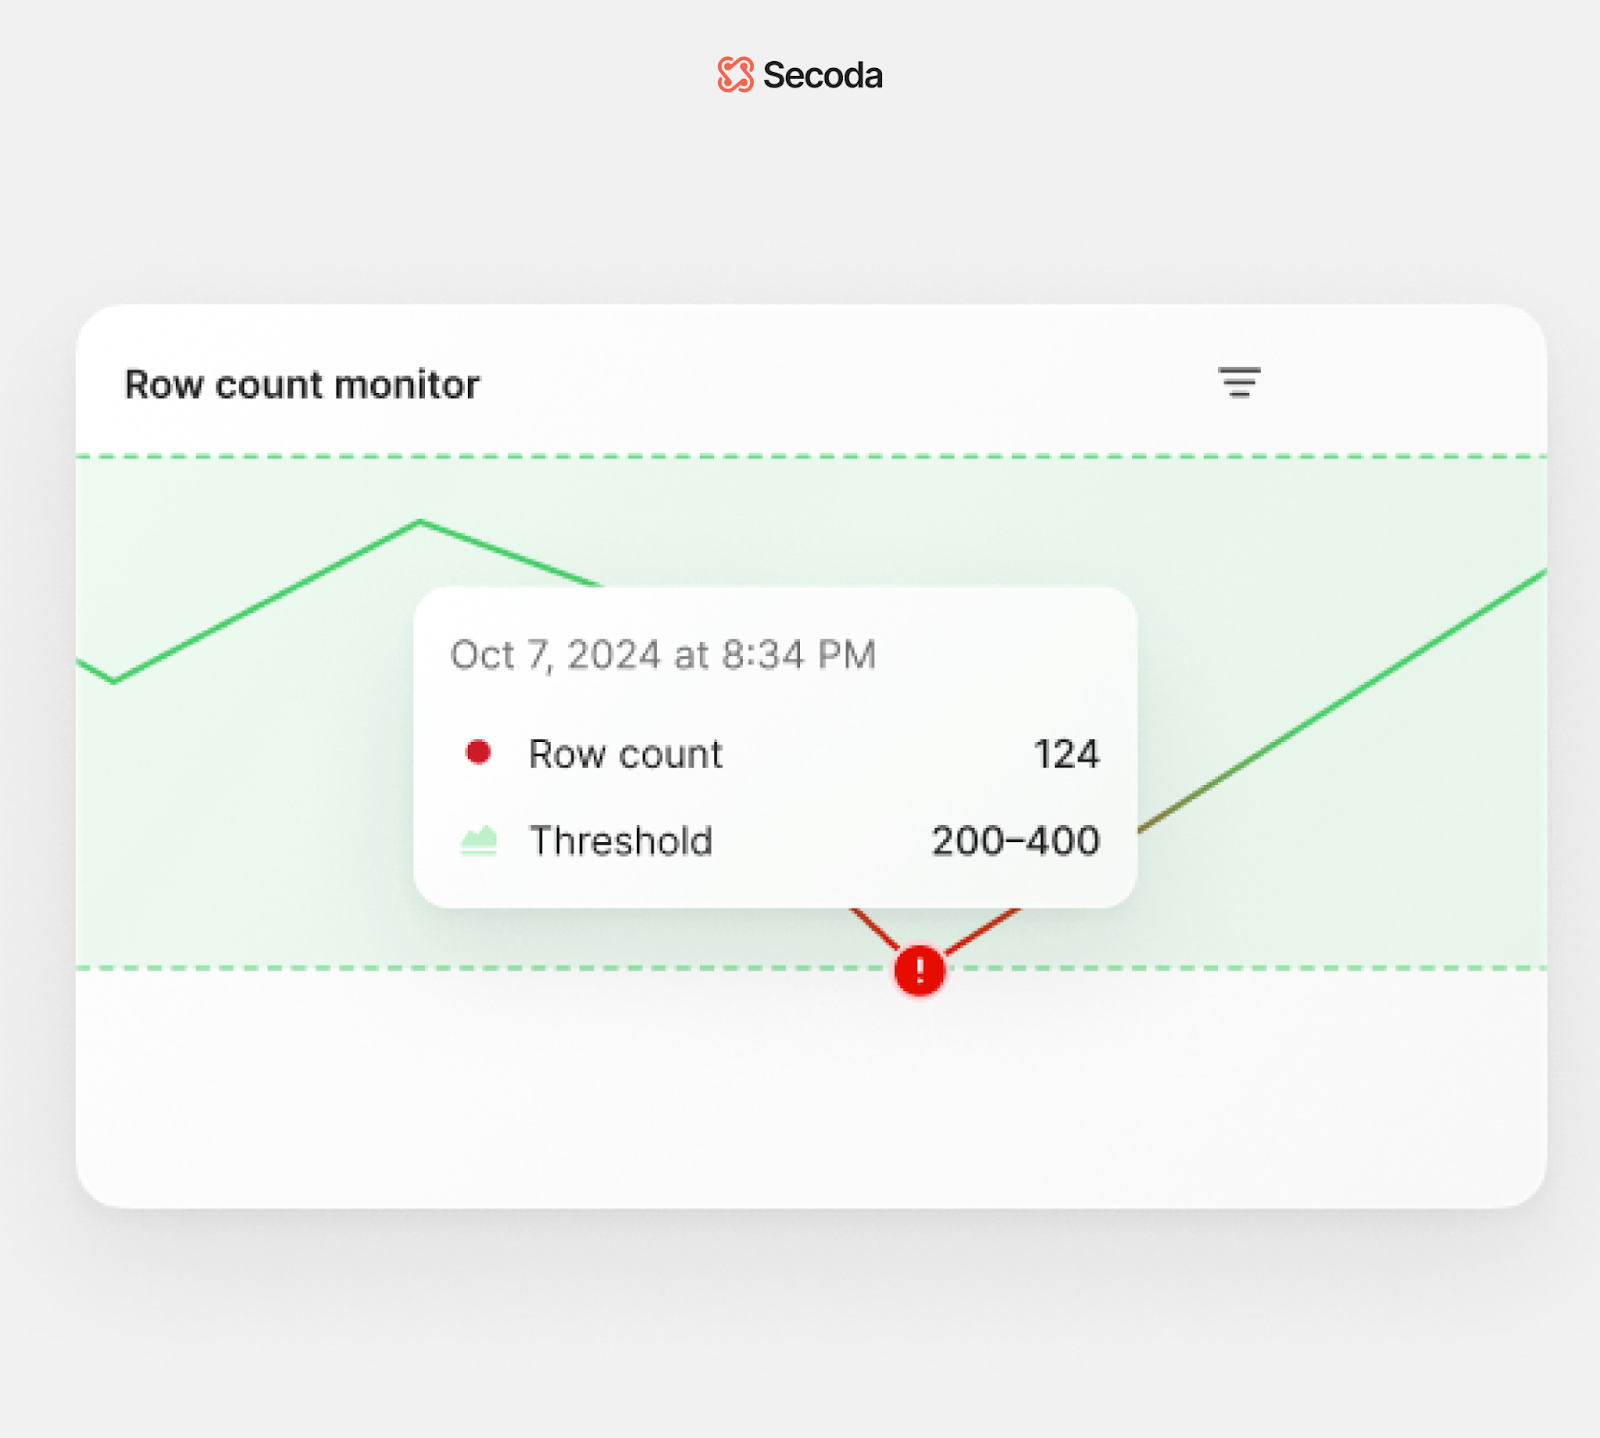
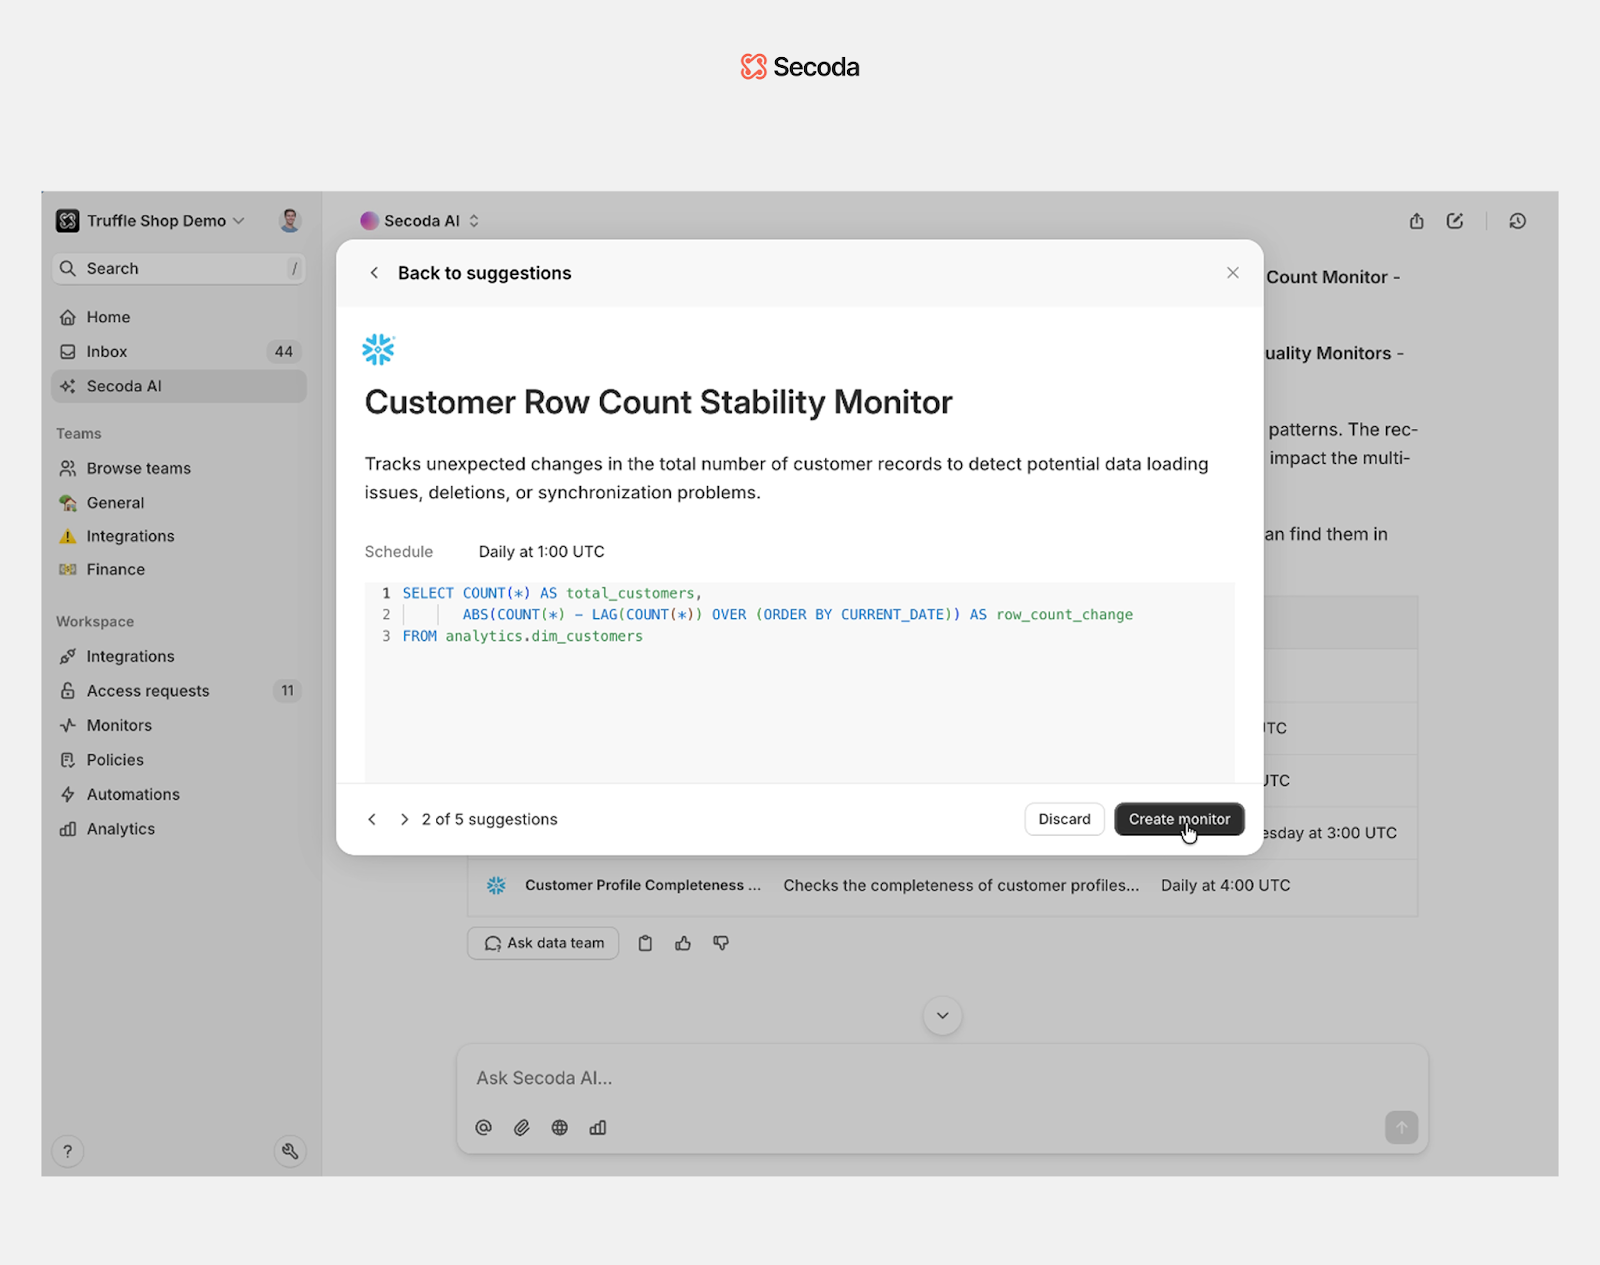
Secoda is an all-in-one data intelligence platform combining cataloging, governance, and observability. Secoda is the only platform in its category to offer a built-in observability suite alongside AI-powered catalog and governance tools.
Key features
- Built-in observability suite with both no-code and custom SQL monitors for freshness, uniqueness, schema changes, query performance, job health, infrastructure costs, and much more
- Data Quality Scores (DQS) aggregate key metrics into a single, actionable health score
- Real-time anomaly detection and proactive threshold-based alerts
- Usage analytics to identify underused or at-risk assets
- Alerts appearing within column-level-lineage and impact analysis to help teams quickly identify and resolve incidents across complex systems
- Multi-channel alerting via Slack, email, and in-app notifications
- Smart alerting groups related incidents and filters out false positives to reduce noise
- Deep integration of observability with catalog context for smarter, more contextual monitoring
- Secoda AI chatbot assists with documentation, data questions, and monitor suggestions on critical assets
- Focuses on monitoring structured data, opposed to unstructured data
Best suited for organizations looking for a unified platform that combines data cataloging, governance, and observability with AI-powered automation, reducing the need for multiple standalone tools.
2. Monte Carlo
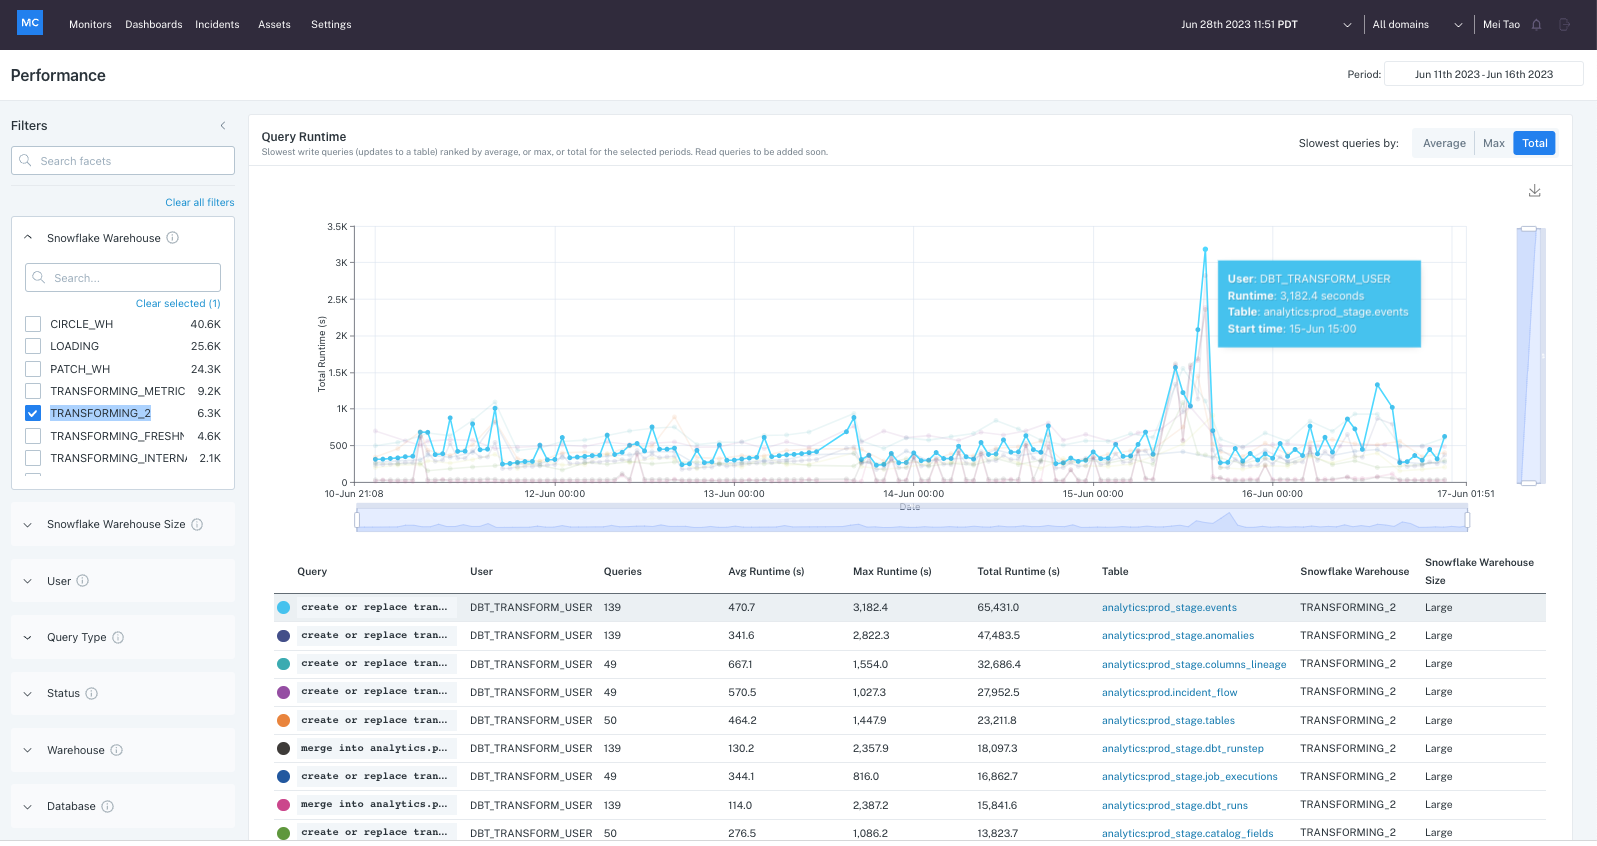
Monte Carlo is a dedicated data observability platform focused on monitoring and incident detection across data pipelines.
Key features
- Specializes in anomaly detection, schema change tracking, and lineage mapping
- Offers Data Product Dashboard and Incident IQ for identifying data issues and understanding downstream impact
- Provides robust integrations with modern data stacks (e.g., Snowflake, dbt, Airflow)
- Focuses exclusively on observability, with limited cataloging or governance features
- Can become costly for organizations seeking broader data management capabilities beyond monitoring
Best suited for teams prioritizing incident response and data reliability over all-in-one functionality.
3. Acceldata
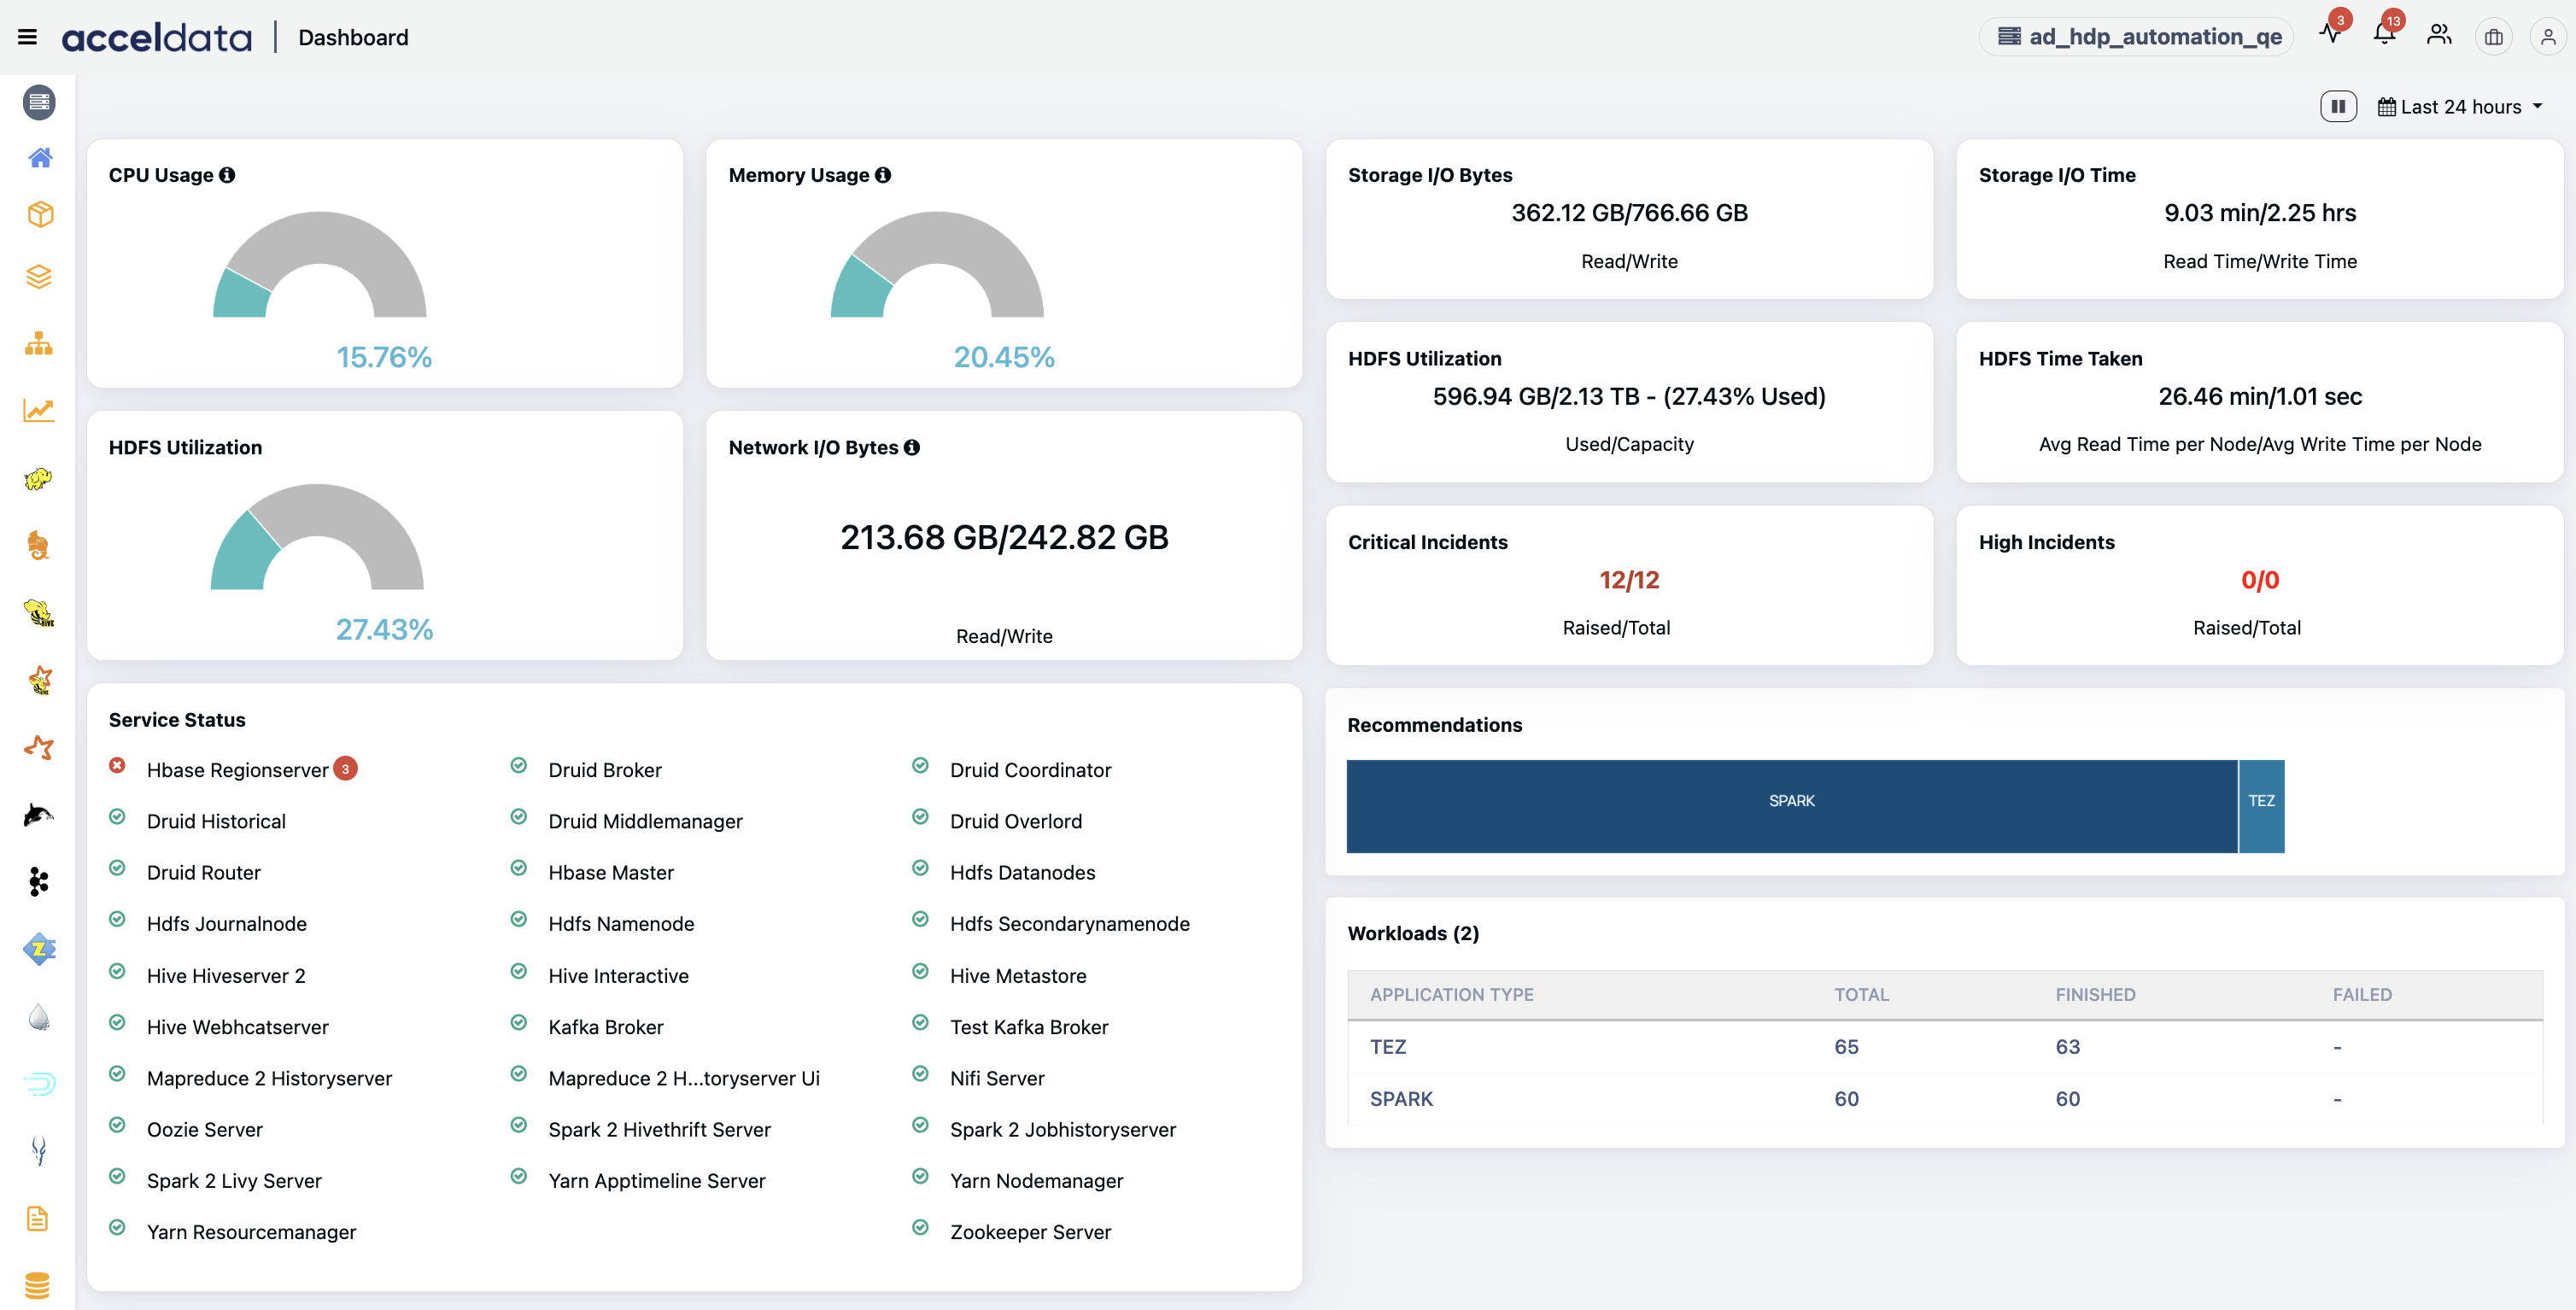
Acceldata is an AI‑driven, multidimensional data observability platform providing visibility into data health, pipeline performance, infrastructure efficiency, governance, and cost across hybrid and multi-cloud environments.
Key features
- Operates across the Five Pillars of observability: data quality, pipeline health, infrastructure, governance, and cost.
- Offers real-time monitoring and automated insights into data reliability, pipeline bottlenecks, and cost control, improving operational efficiency.
- Includes intuitive tools like Pulse (for infrastructure and performance metrics) and Torch (for pipeline reliability, quality, and lineage), sharing context across operational layers.
- Spend intelligence capabilities deliver chargeback insights, cost forecasting, and real‑time budgeting controls, helping optimize spending.
- AI agents that proactively monitor, plan, and enforce data policies across hybrid environments.
Best suited for enterprise teams needing deep visibility into data quality, pipeline health, and cost across complex, multi-cloud environments.
4. Bigeye
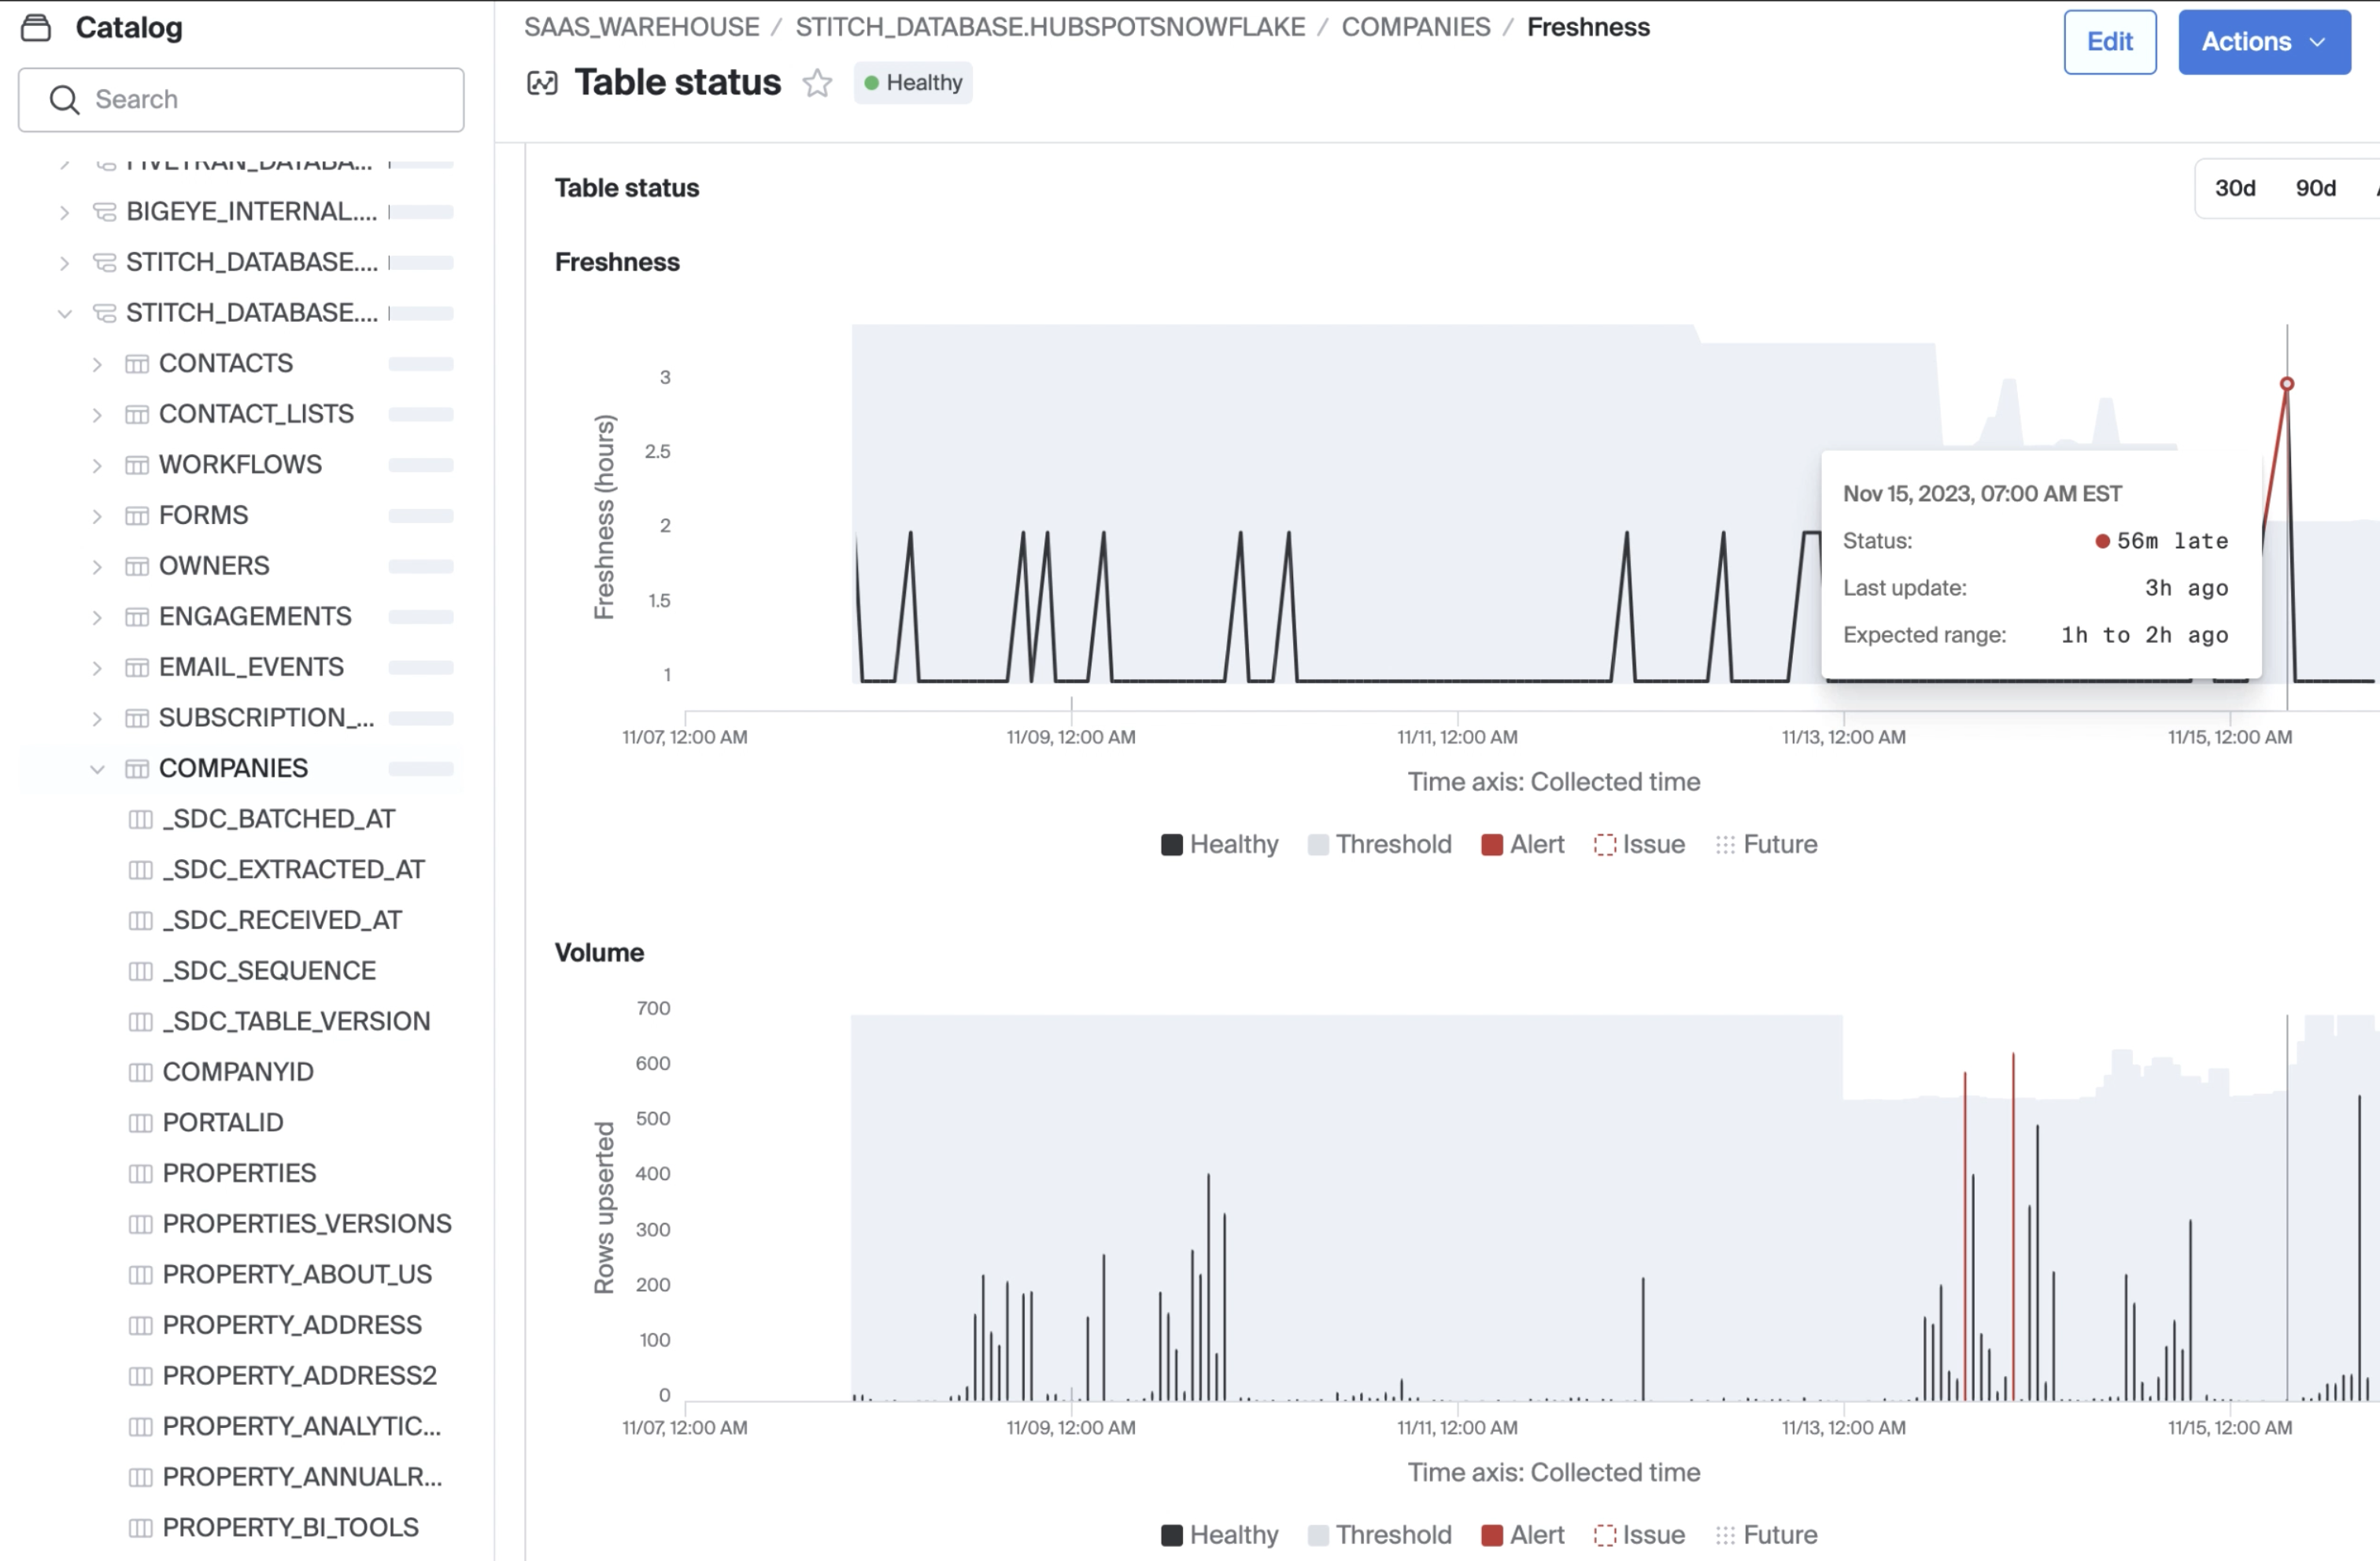
Bigeye is an enterprise-grade data observability platform designed to monitor data quality, lineage, and pipeline health across both modern and legacy data stacks.
Key features
- Offers lineage‑enabled data observability to help teams quickly identify, triage, and resolve data incidents across complex and hybrid environments.
- Provides automated anomaly detection, schema change alerts, data reconciliation, and real‑time alerting tailored to critical data assets.
- Supports fast setup with broad connector coverage across cloud and on‑prem systems.
- Enables automated root-cause and impact analysis using lineage-driven workflows and intuitive data health summaries for stakeholders.
- Includes features like a browser extension, dashboards, and support for over 70 data quality metrics to surface issues and streamline remediation.
Best suited for data teams in large enterprises that need deep diagnostic observability and lineage tracking across diverse and legacy data environments, but may be overkill in price and complexity for smaller-scale needs.
5. DQ Labs
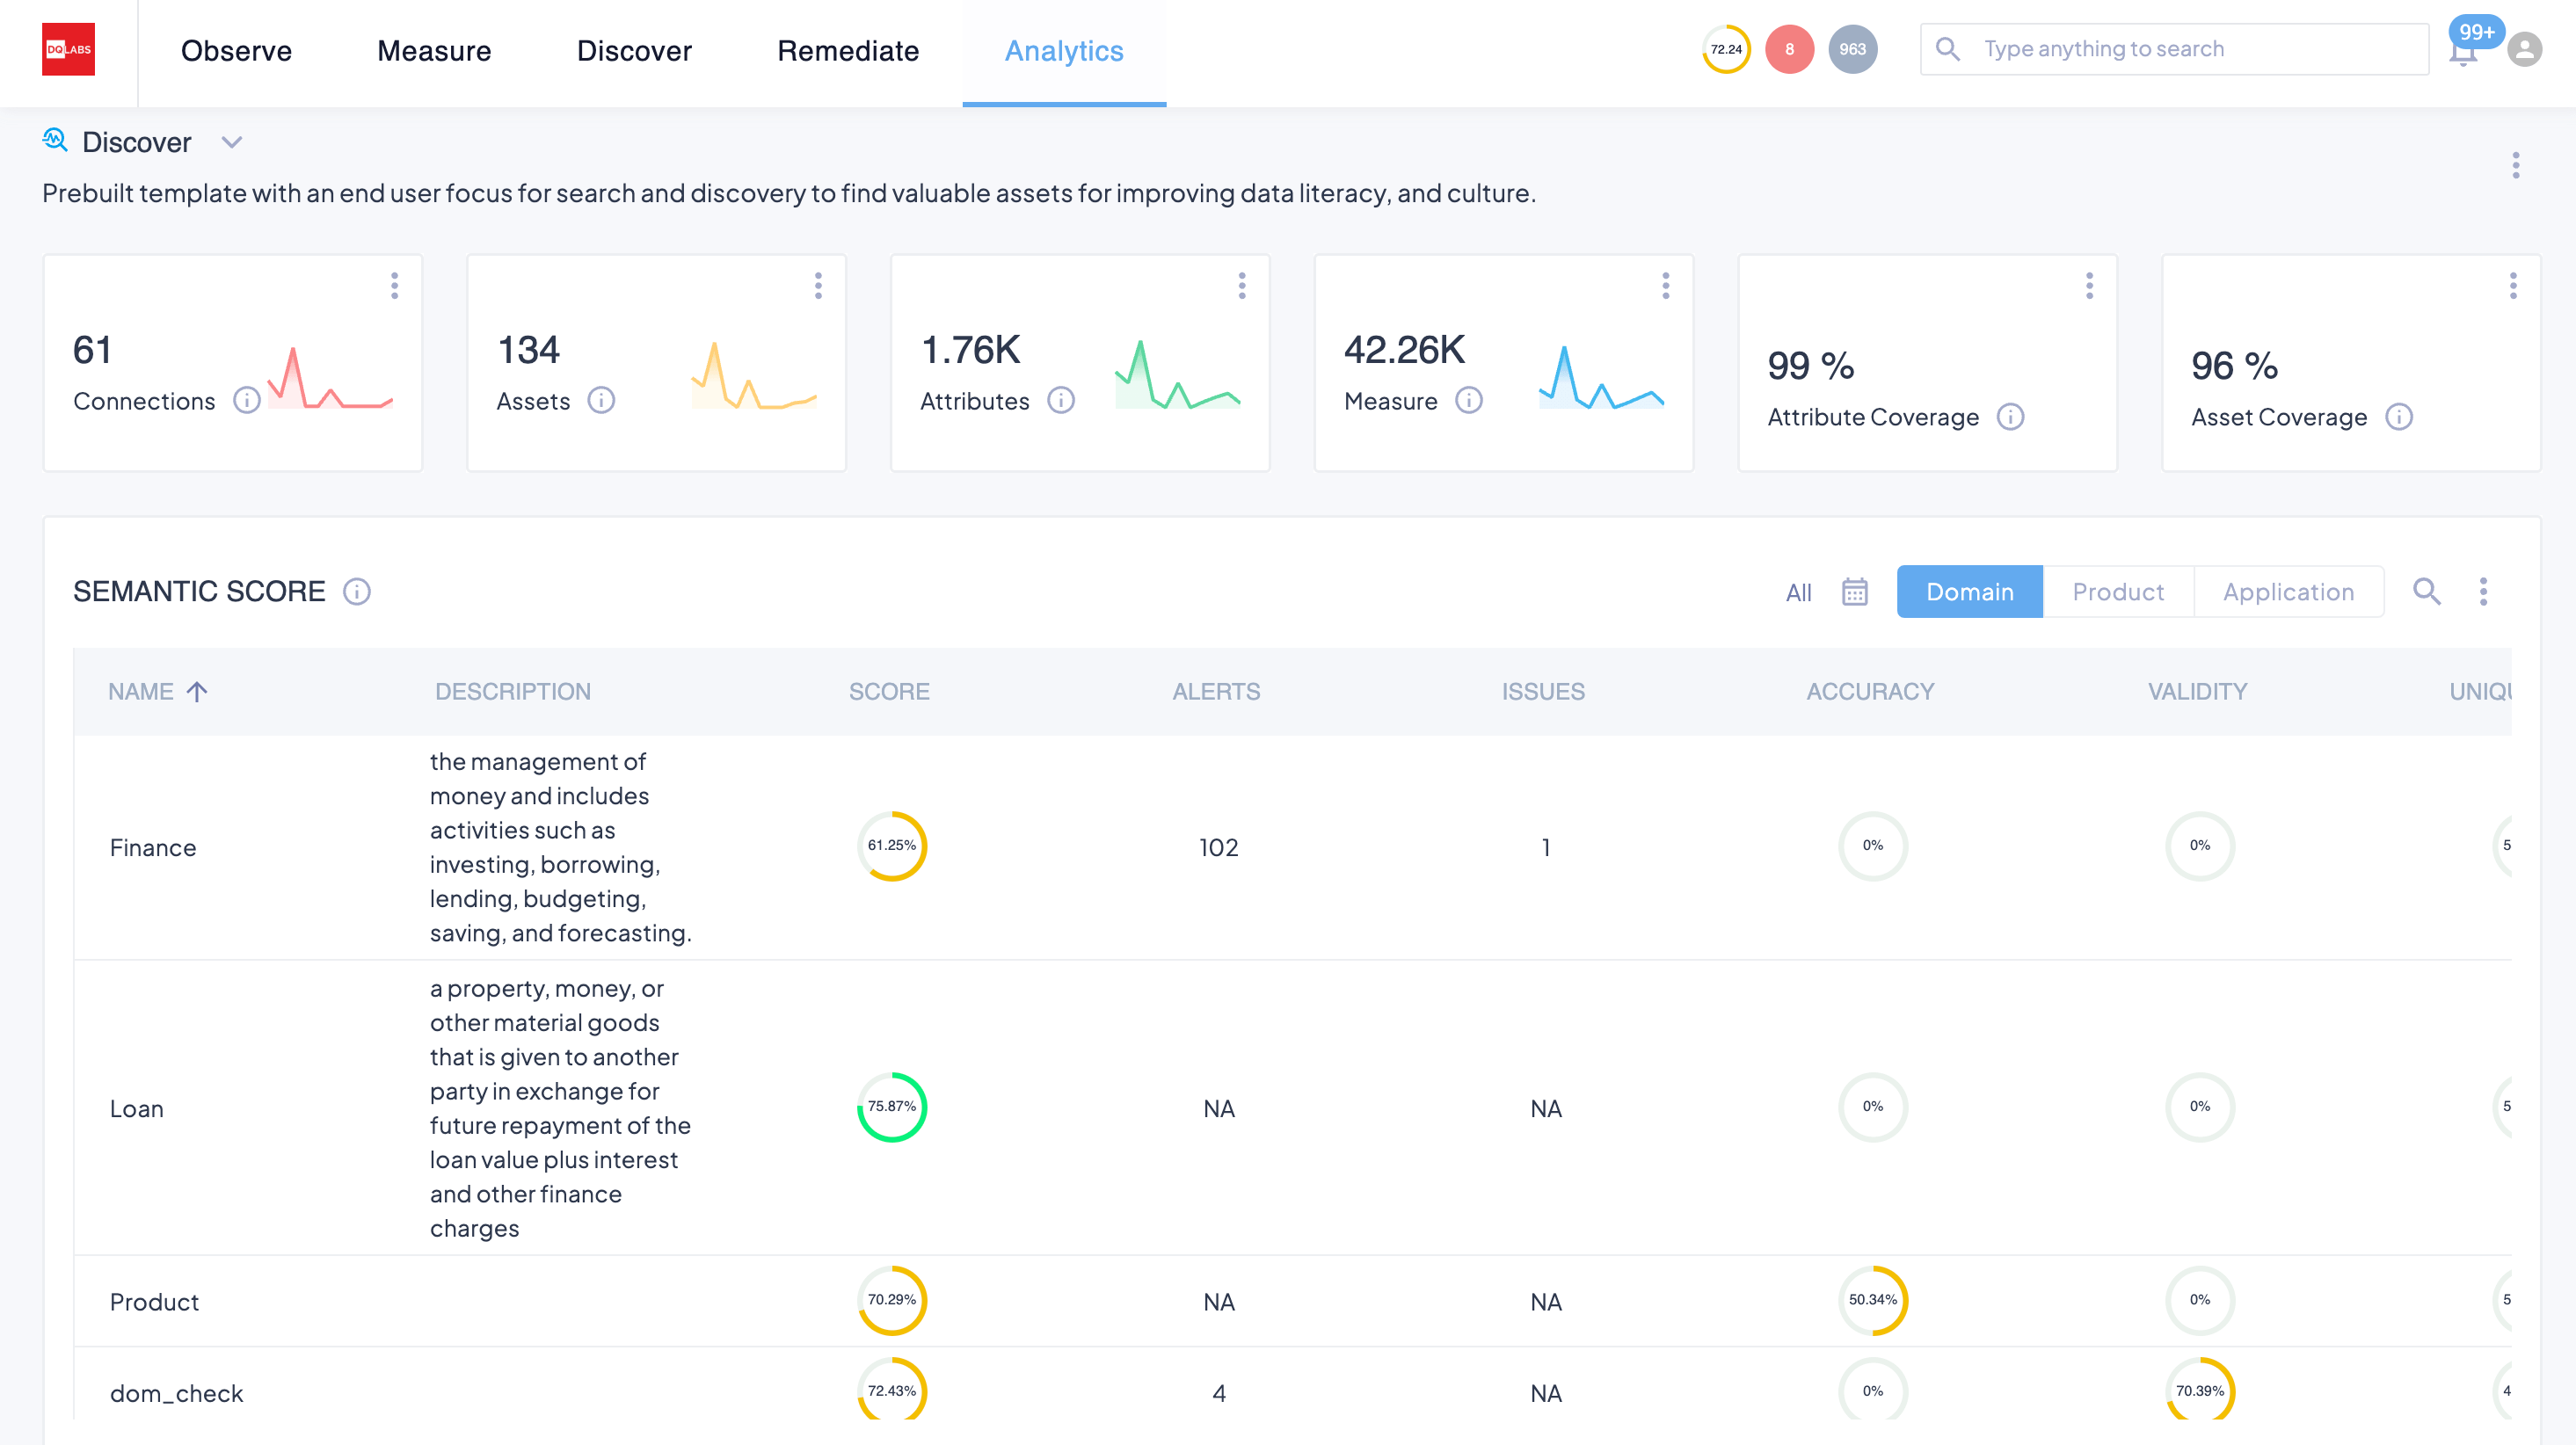
DQ Labs is an AI-powered platform unifying data observability, quality, and discovery into an autonomous solution for trusted data.
Key features
- Unifies data observability, data quality, and data discovery with AI/ML-driven anomaly detection, issue resolution, and semantic insights.
- Offers no-code, customizable checks across accuracy, completeness, validity, uniqueness, and timeliness
- Provides end-to-end lineage, pipeline monitoring (throughput, latency), schema-change detection, and automated impact analysis.
- Includes usage and behavior observability, such as query patterns and access trends, to support governance and cost optimization.
- Embeds semantic discovery and GenAI-powered remediation, with bi-directional catalog integration and intelligent issue management workflows.
Best suited for teams aiming for a highly automated, semantic-rich observability and data quality platform across modern and hybrid stacks.
6. Ataccama
Ataccama is an AI-augmented unified data trust platform combining observability, data quality, cataloging, lineage, governance, and master data management.
Key features
- Seamlessly integrates data observability including anomaly detection, schema drift monitoring, freshness tracking, and lineage, into the Ataccama ONE platform.
- Supports automated data profiling, AI-powered anomaly detection, and multi-channel alerts (Slack, Teams, email), ensuring comprehensive data health monitoring.
- AI-generated rule suggestions and natural language rule creation streamline setup across data quality and observability workflows
- Advanced features like edge processing and pushdown execution reduce data movement in large-scale cloud environments
- Platform breadth and configuration depth may require longer implementation cycles and skilled users to fully unlock value
Best suited for large enterprises with mature data teams looking for a comprehensive but complex platform that combines observability with governance and MDM at scale.
7. IBM Databand
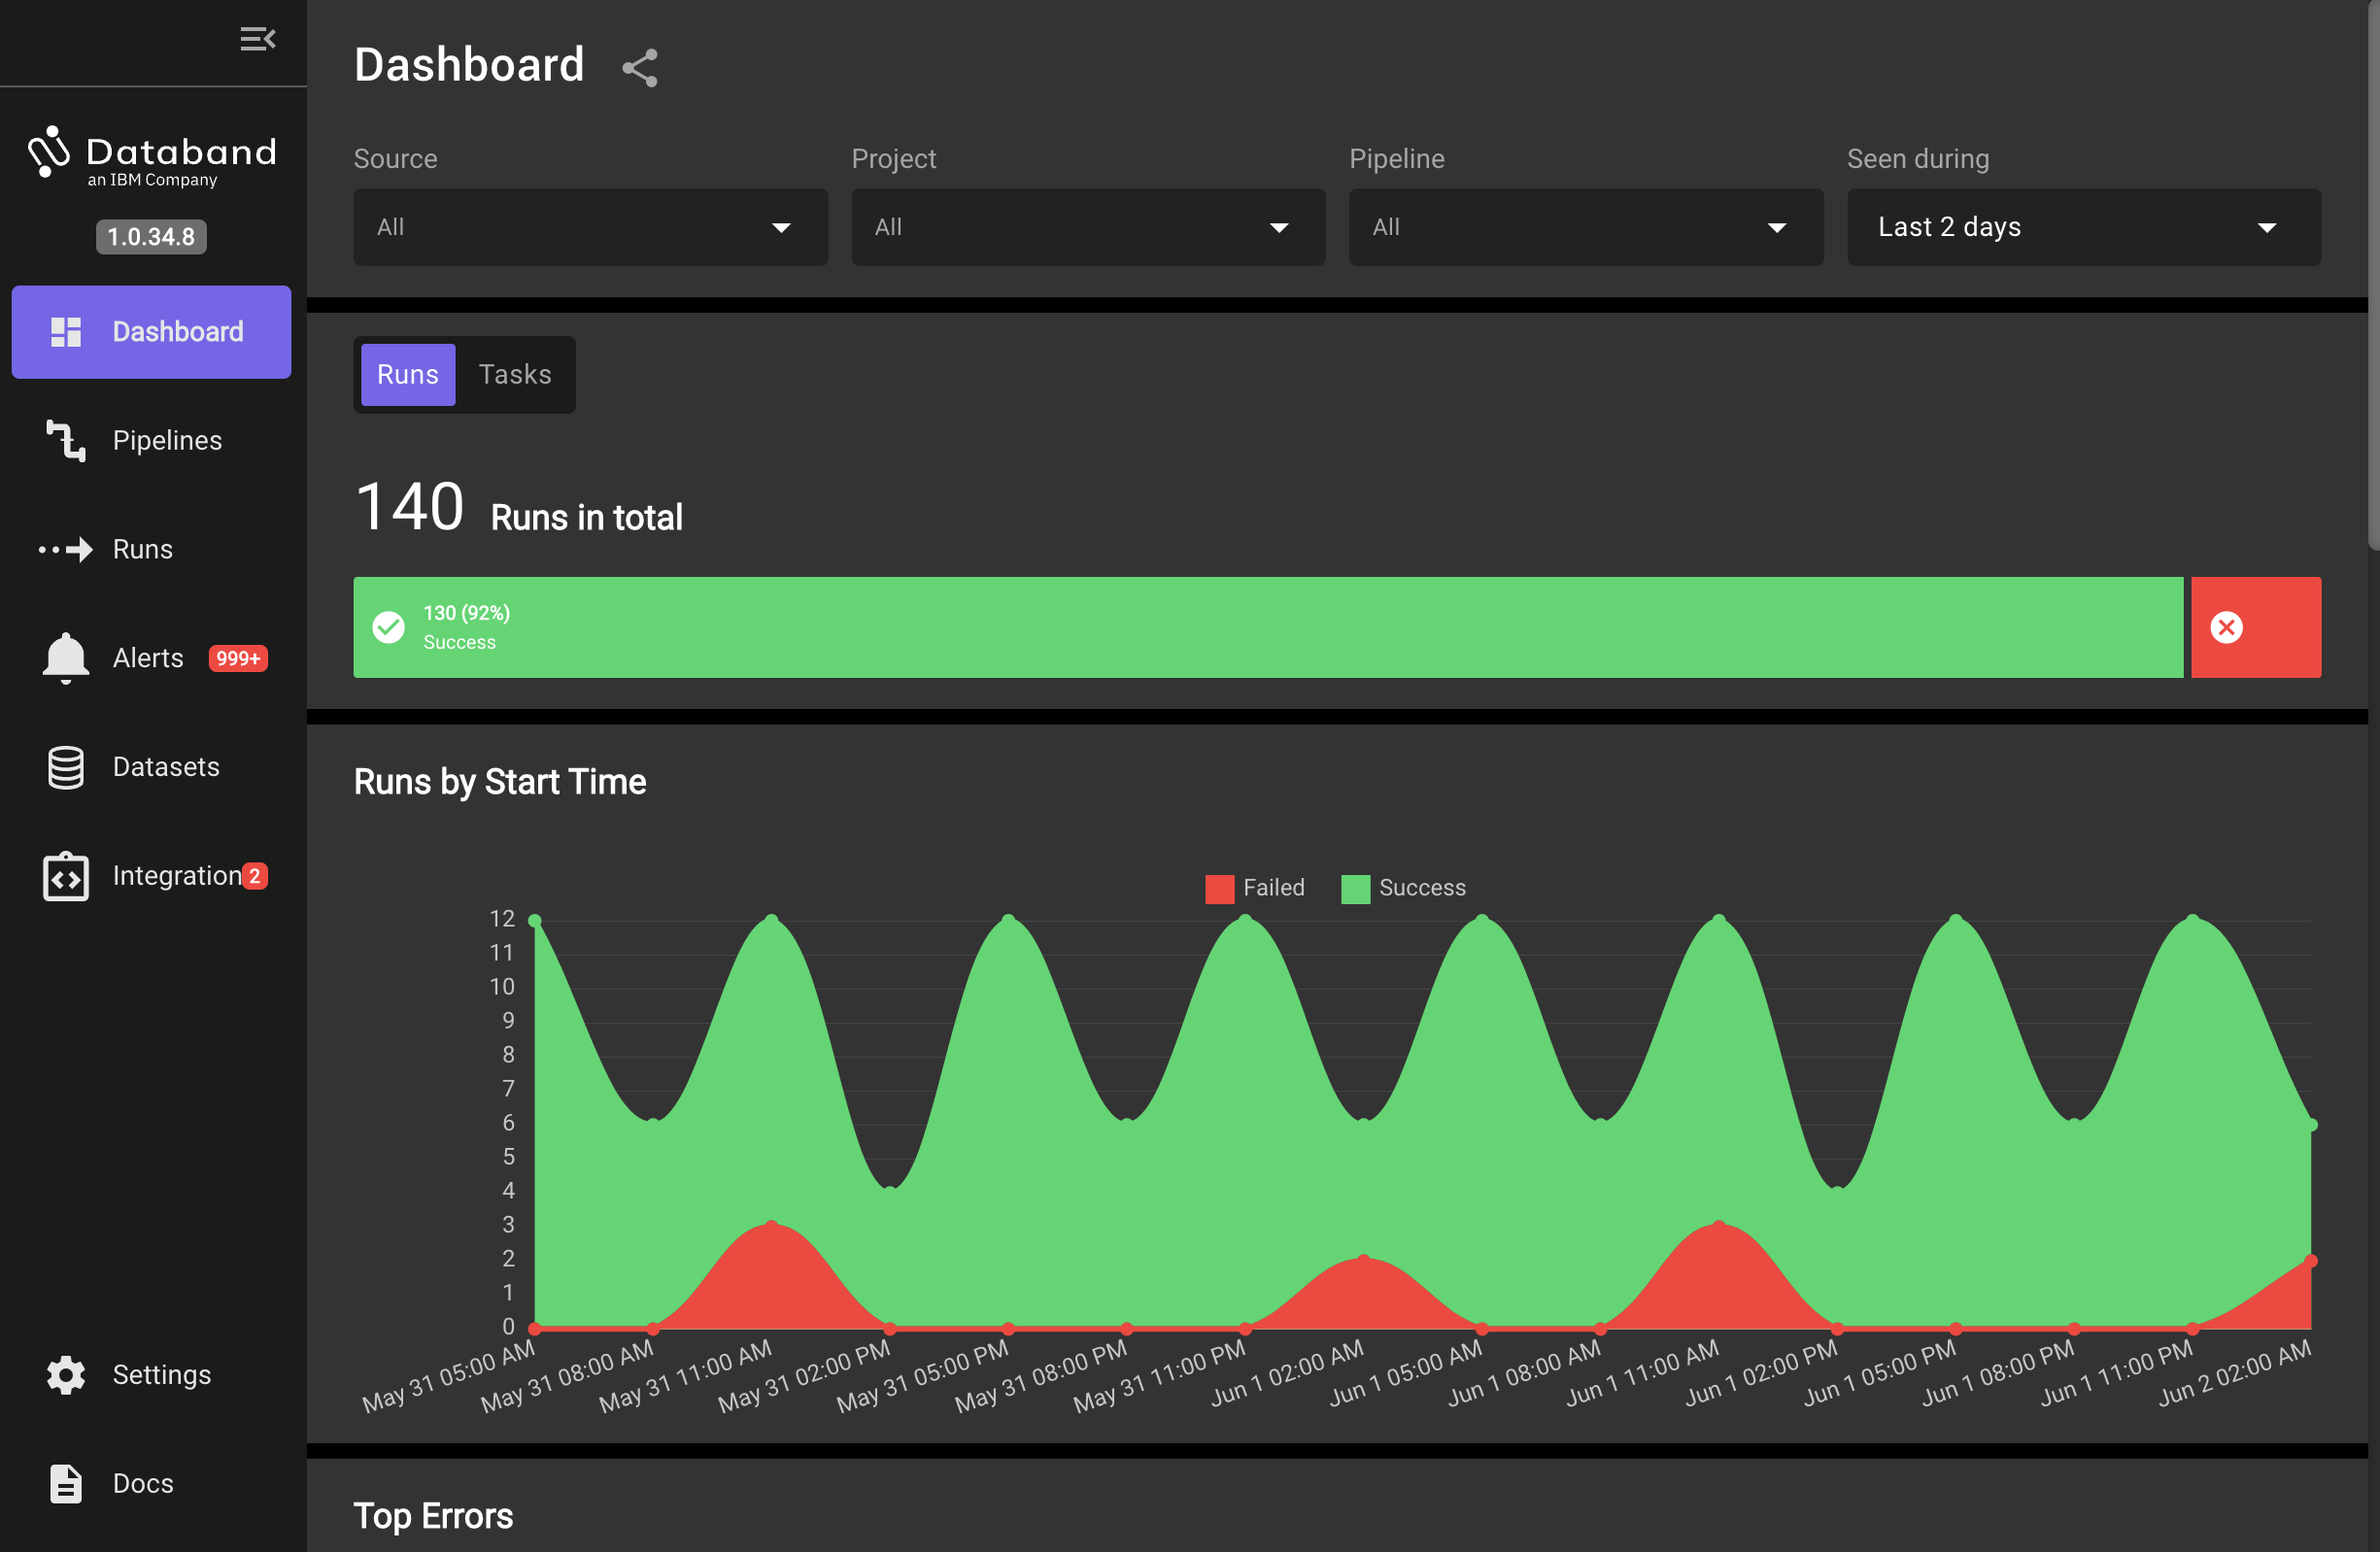
IBM Databand is a dedicated data observability platform that monitors pipelines and warehouses in real time using metadata-driven baselines, anomaly detection, and incident workflows.
Key features
- Automatically collects metadata to establish historical baselines, detect anomalies, trigger alerts, and support remediation workflows.
- Offers end-to-end visibility into pipelines, including lineage tracing, run-duration anomalies, SLAs, and schema changes.
- Integrates with modern stacks such as dbt, Airflow, Spark, Snowflake, Databricks for pipeline monitoring and dbt job/test observability.
- Available as a SaaS offering on AWS with flexible, tiered pricing.
- Limited integration coverage and higher costs for smaller teams.
Best suited for medium to large organizations with mature data operations that need proactive pipeline observability and incident diagnostics, but which may find setup complex and pricing steep for smaller teams.
8. Anomalo
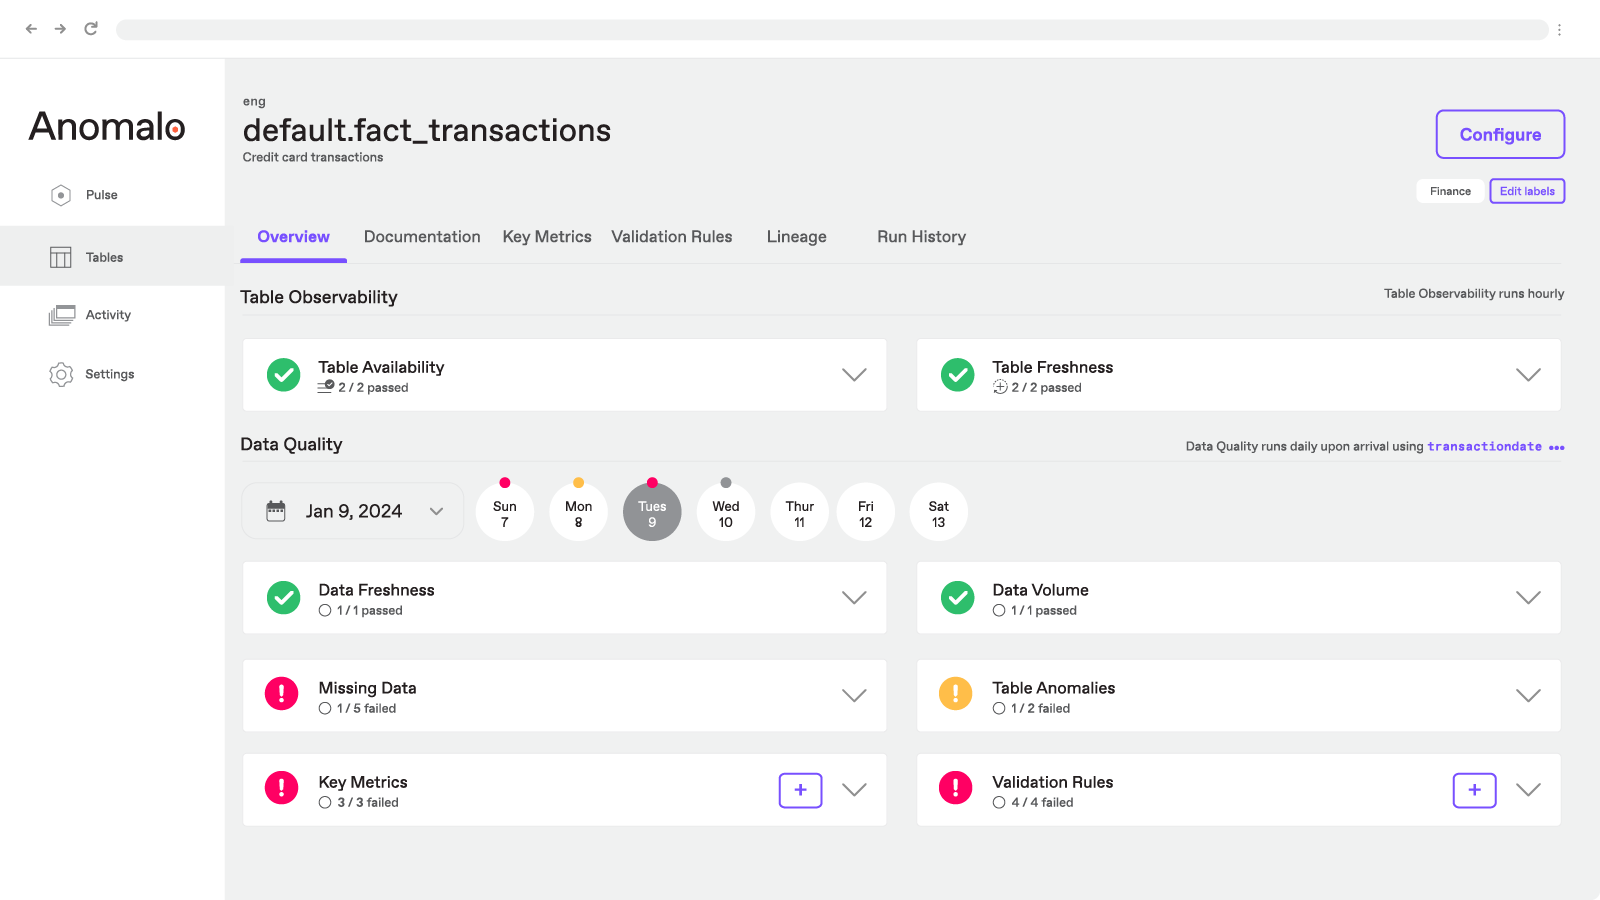
Anomalo is an AI-first data quality and observability platform built to surface unknown anomalies in both structured and unstructured data using unsupervised machine learning.
Key features
- Detects and resolves approximately 80% of data anomalies autonomously using ML, while providing low-code rule creation for edge cases.
- Monitors both structured and unstructured data, including large sets like documents or conversation logs; adds specialized workflows for GenAI use cases.
- Automatically performs root cause analysis with visual examples of "good" and "bad" data, helping teams triage issues rapidly.
Best suited for data teams that need to monitor high-volume, diverse data (including documents and logs) with minimal manual configuration, but may require additional calibration for nuanced seasonal or context-specific datasets.
9. Soda
.png)
Soda is an open-source and collaborative data quality and observability platform combining metric monitoring, data contracts, and lightweight anomaly detection.
Key features
- Delivers broad data observability using ML‑powered metric tracking (e.g., schema, freshness, and row counts) with anomaly detection that begins working within minutes and backfills up to a year of historical trends.
- Supports collaborative data contracts and testing through both code and no-code UIs.
- Employs a purpose-built anomaly detection engine designed to minimize false positives and adapt over time.
- Offers a user-friendly interface accessible across roles, enabling cross-functional participation in data quality workflows.
- Observability signals highlight issues but still require teams to manually validate and resolve anomalies, especially for recurring patterns.
Best suited for collaborative teams needing fast, scalable observability and proactive testing adoption, but expect to invest effort interpreting alerts and following through on resolution.
10. Validio
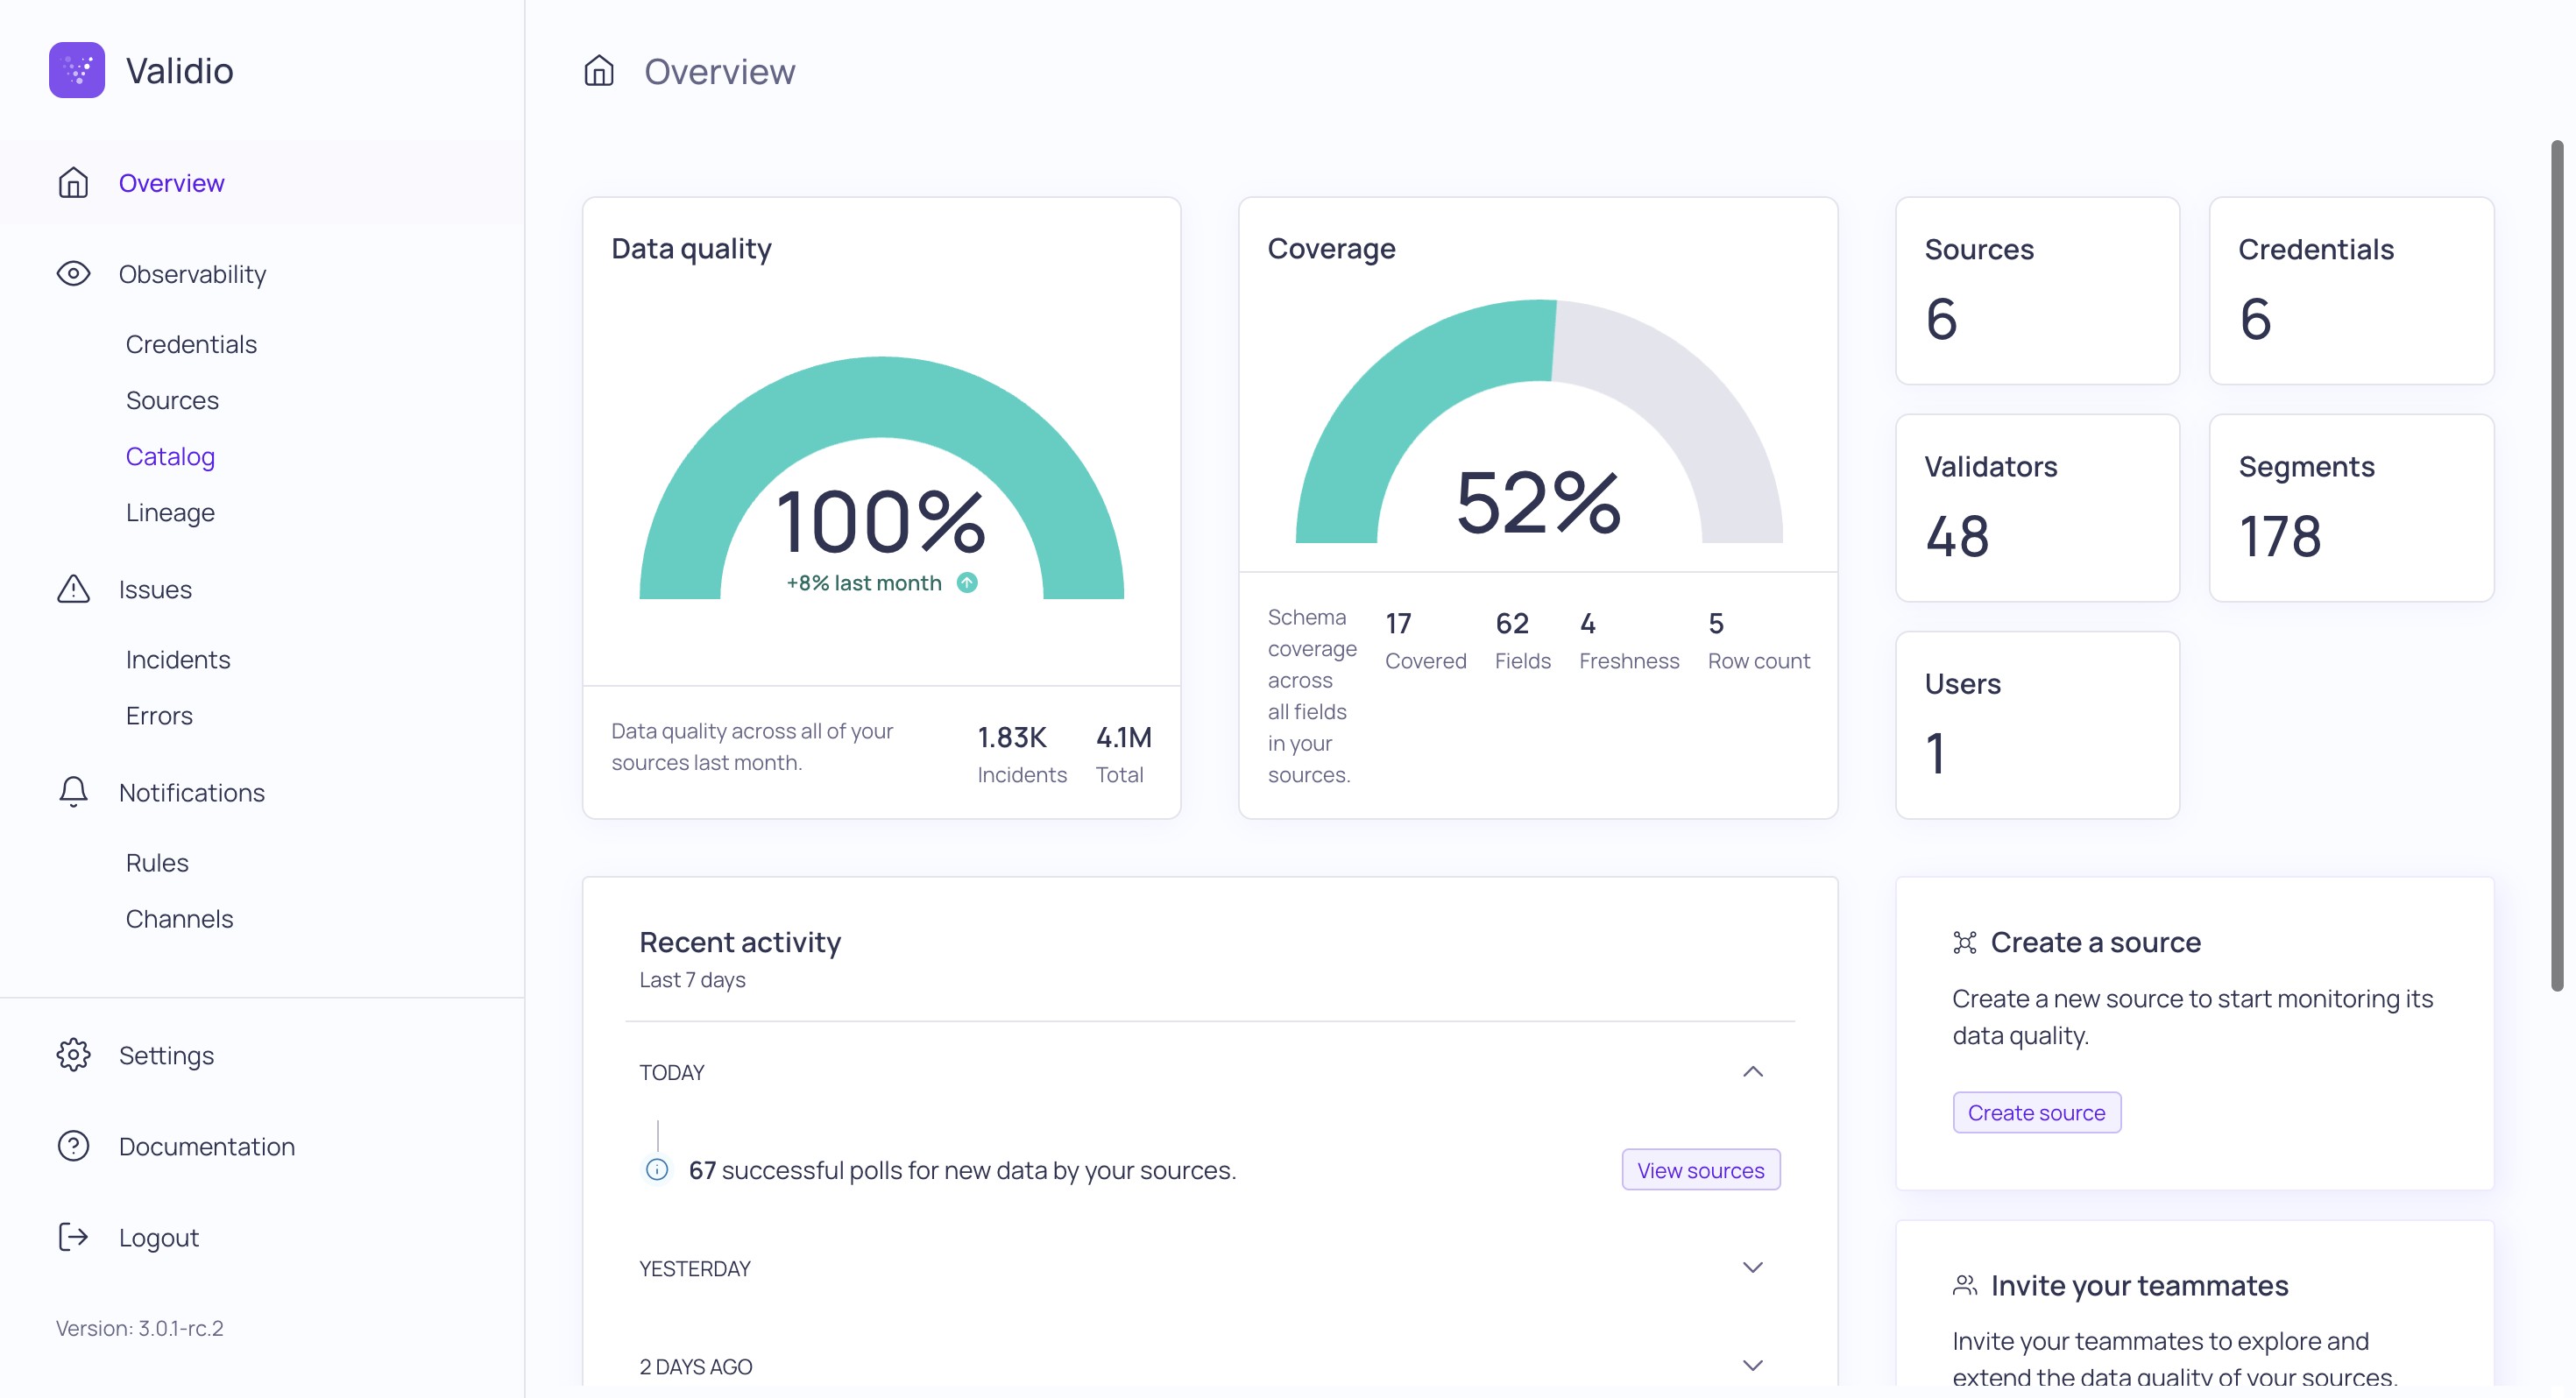
Validio is an AI-driven data observability and quality platform offering real-time monitoring, deep segmentation, and lineage insights to ensure data trust across business metrics.
Key features
- Provides real-time, ML-powered anomaly detection across all levels of your data stack, with rapid backfilling and segmentation to adapt to evolving business patterns.
- Integrates tightly with your data lineage
- Smart alerting groups related incidents and filters out false positives to reduce noise, while a debug feature generates sample SQL for fast issue investigation.
- Offers data asset discovery, usage insights, ownership controls, and metadata hygiene
Best suited for teams needing high-velocity observability across massive datasets, deep segmentation, and quick root cause tracking, even if some fine-tuning is required to optimize alerts for specific business contexts.
11. Sifflet

Sifflet is an AI-native, full-stack observability platform built to bring data discovery, monitoring, and troubleshooting into one context-aware, business-ready experience.
Key features
- Delivers unified data discovery, monitoring, and troubleshooting with strong lineage and dependency mapping from ingestion through BI dashboards.
- Applies AI-powered agents to surface business-context-aware alerts, reduce noise, and guide issue resolution based on historical patterns.
- Offers a searchable, smart catalog and field-level lineage so both technical and business users can understand, trace, and trust data assets.
Best suited for teams that want observability embedded with business context and streamlined issue resolution through AI, but may need patience with setup and feature tuning before realizing full value.
12. Qualdo

Qualdo is a zero-code, cloud-native data observability and reliability platform delivering comprehensive monitoring for data quality, anomalies, drifts, and performance across AWS, Azure, and Google Cloud.
Key features
- Offers point‑and‑click integrations with modern cloud data systems
- Tracks 75+ reliability and quality metrics including completeness, drift, anomalies, outliers, uniqueness, and schema conformity
- Combines data observability, quality, and reliability in a single package
- Delivers 24/7 monitoring with automated alerts to Slack, email, and dashboards
Best suited for data teams in mid‑size enterprises or startups aiming for fast, affordable, and cloud-first data observability.
13. Metaplane
.png)
Metaplane is a modern, ML-powered data observability platform that delivers real-time monitoring, lineage, and anomaly detection directly within the data stack.
Key features
- Machine learning–based monitors adapt to seasonal trends, schema changes, and query behavior within days of setup
- Seamlessly integrates with tools like Snowflake, dbt, Looker, Tableau, and Slack, enabling full-stack observability in under 15 minutes
- Offers strong lineage and impact analysis, including visibility into downstream dashboards before schema updates
- Supports data CI/CD workflows, including PR merge testing, alert grouping, and flexible channel routing for notifications
- Newly integrated into Datadog, allowing future unification of application, infrastructure, and data observability in one platform
Best suited for data teams seeking fast implementation of adaptive observability within modern data stacks, though teams should be ready to tune alert rules to manage noise effectively.
14. Datafold
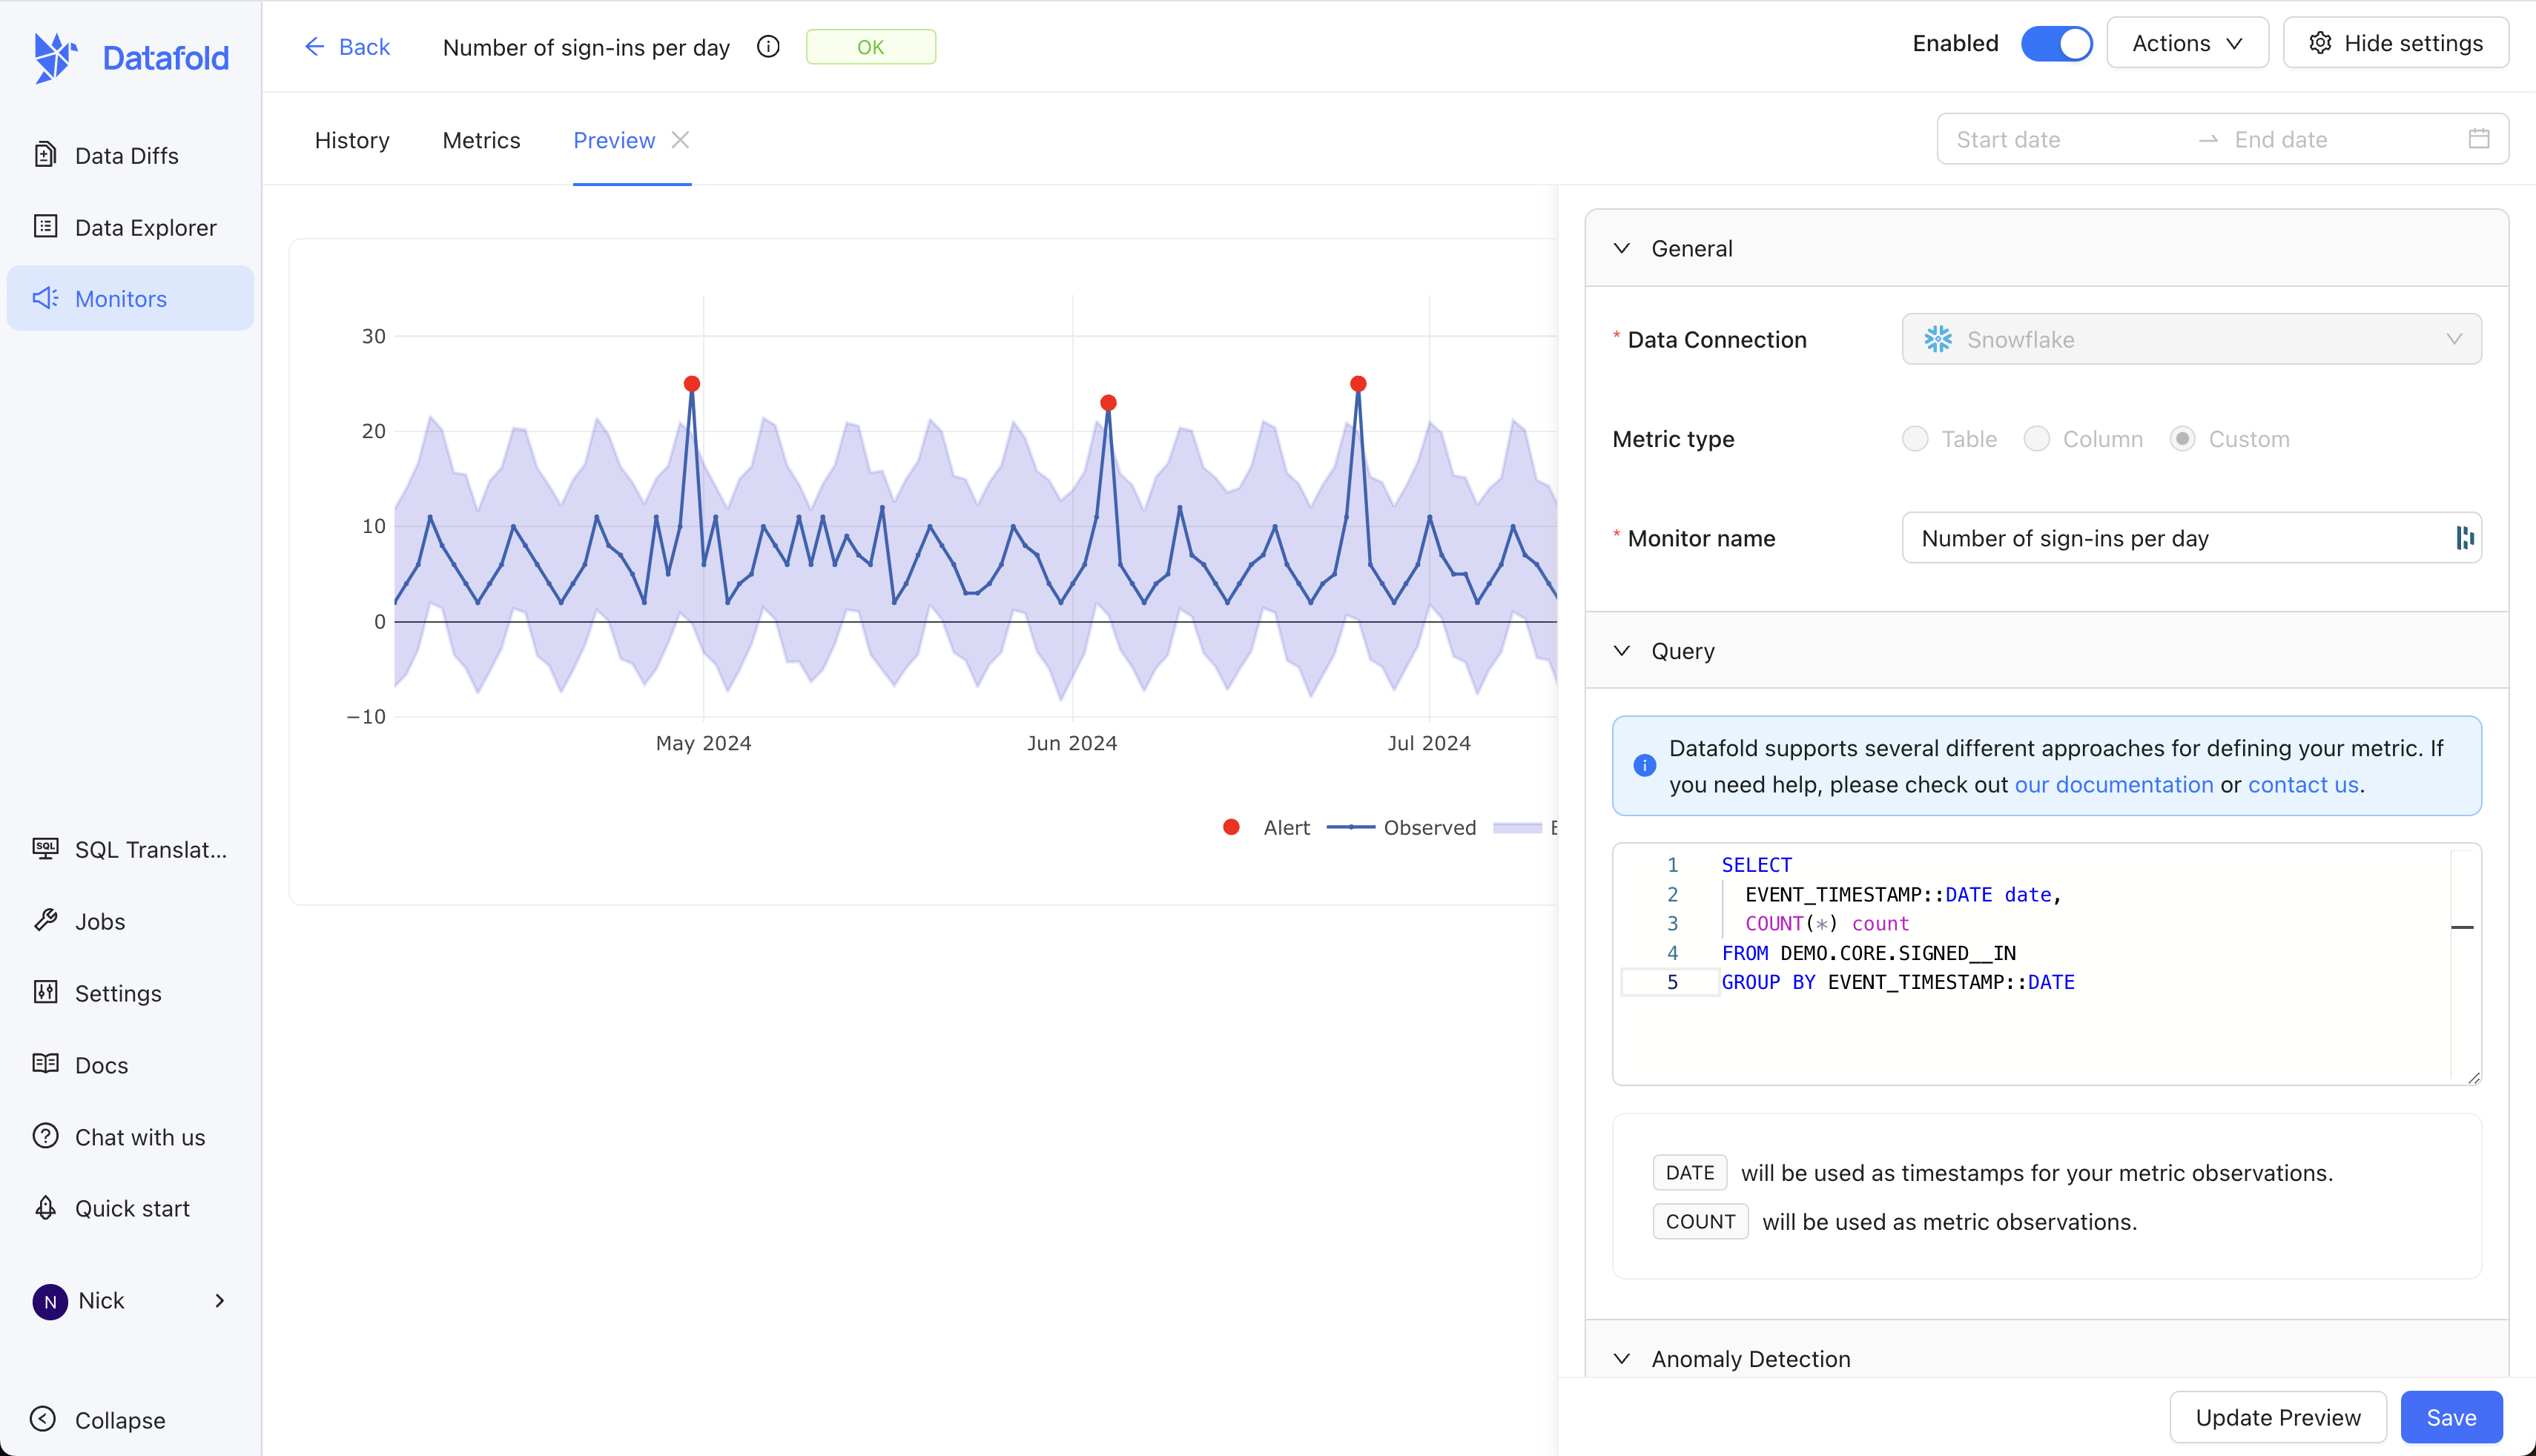
Datafold is a unified data reliability platform that brings proactive data quality testing, monitoring, lineage, and CI/CD integration into one.
Key features
- Automates data diffing and regression testing (like a Git diff, but for tables), catching issues before deployment
- Combines CI/CD testing, real-time anomaly detection, and column-level lineage into a single observability workflow
- Accelerates migrations and transformation pipelines with AI-driven SQL conversion and cross-database validation
- Scales to enterprise needs with flexible deployment (SaaS, VPC, on-prem), robust security, and access controls
Best suited for data engineering teams focused on proactive, developer-centric quality workflows across modern pipelines. Works well for dbt users.
15. Telmai
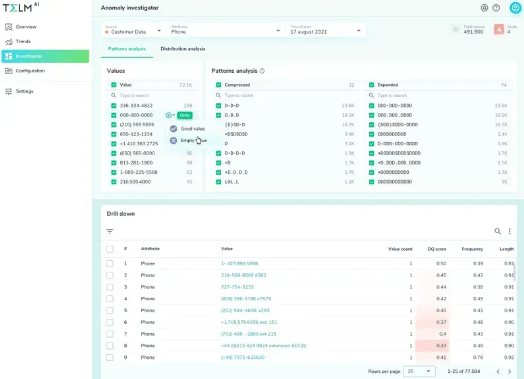
Telmai is an AI-powered data observability platform built for open‑architecture environments, monitoring structured and semi-structured data across pipelines, lakes, and streaming systems.
Key features
- Supports real-time anomaly detection without sampling, connecting via no-code integrations to 250+ sources, including data lakes, warehouses, and message queues
- Operates at record-level scale using a Spark-based engine, enabling extensive monitoring without straining core infrastructure or incurring cloud cost surges
- Delivers full upstream-to-downstream observability with cross-system lineage, multi-attribute validation rules, data binning, and predictive time‑travel retrospectives for faster rule tuning
- Offers flexible deployment via AWS/GCP/Azure marketplace or private cloud within customer VPC
Best suited for data teams in mid-to-large organizations that need highly scalable, granular observability across complex or heterogeneous data systems, and who are equipped to invest time in customization and tuning.
16. Dynatrace
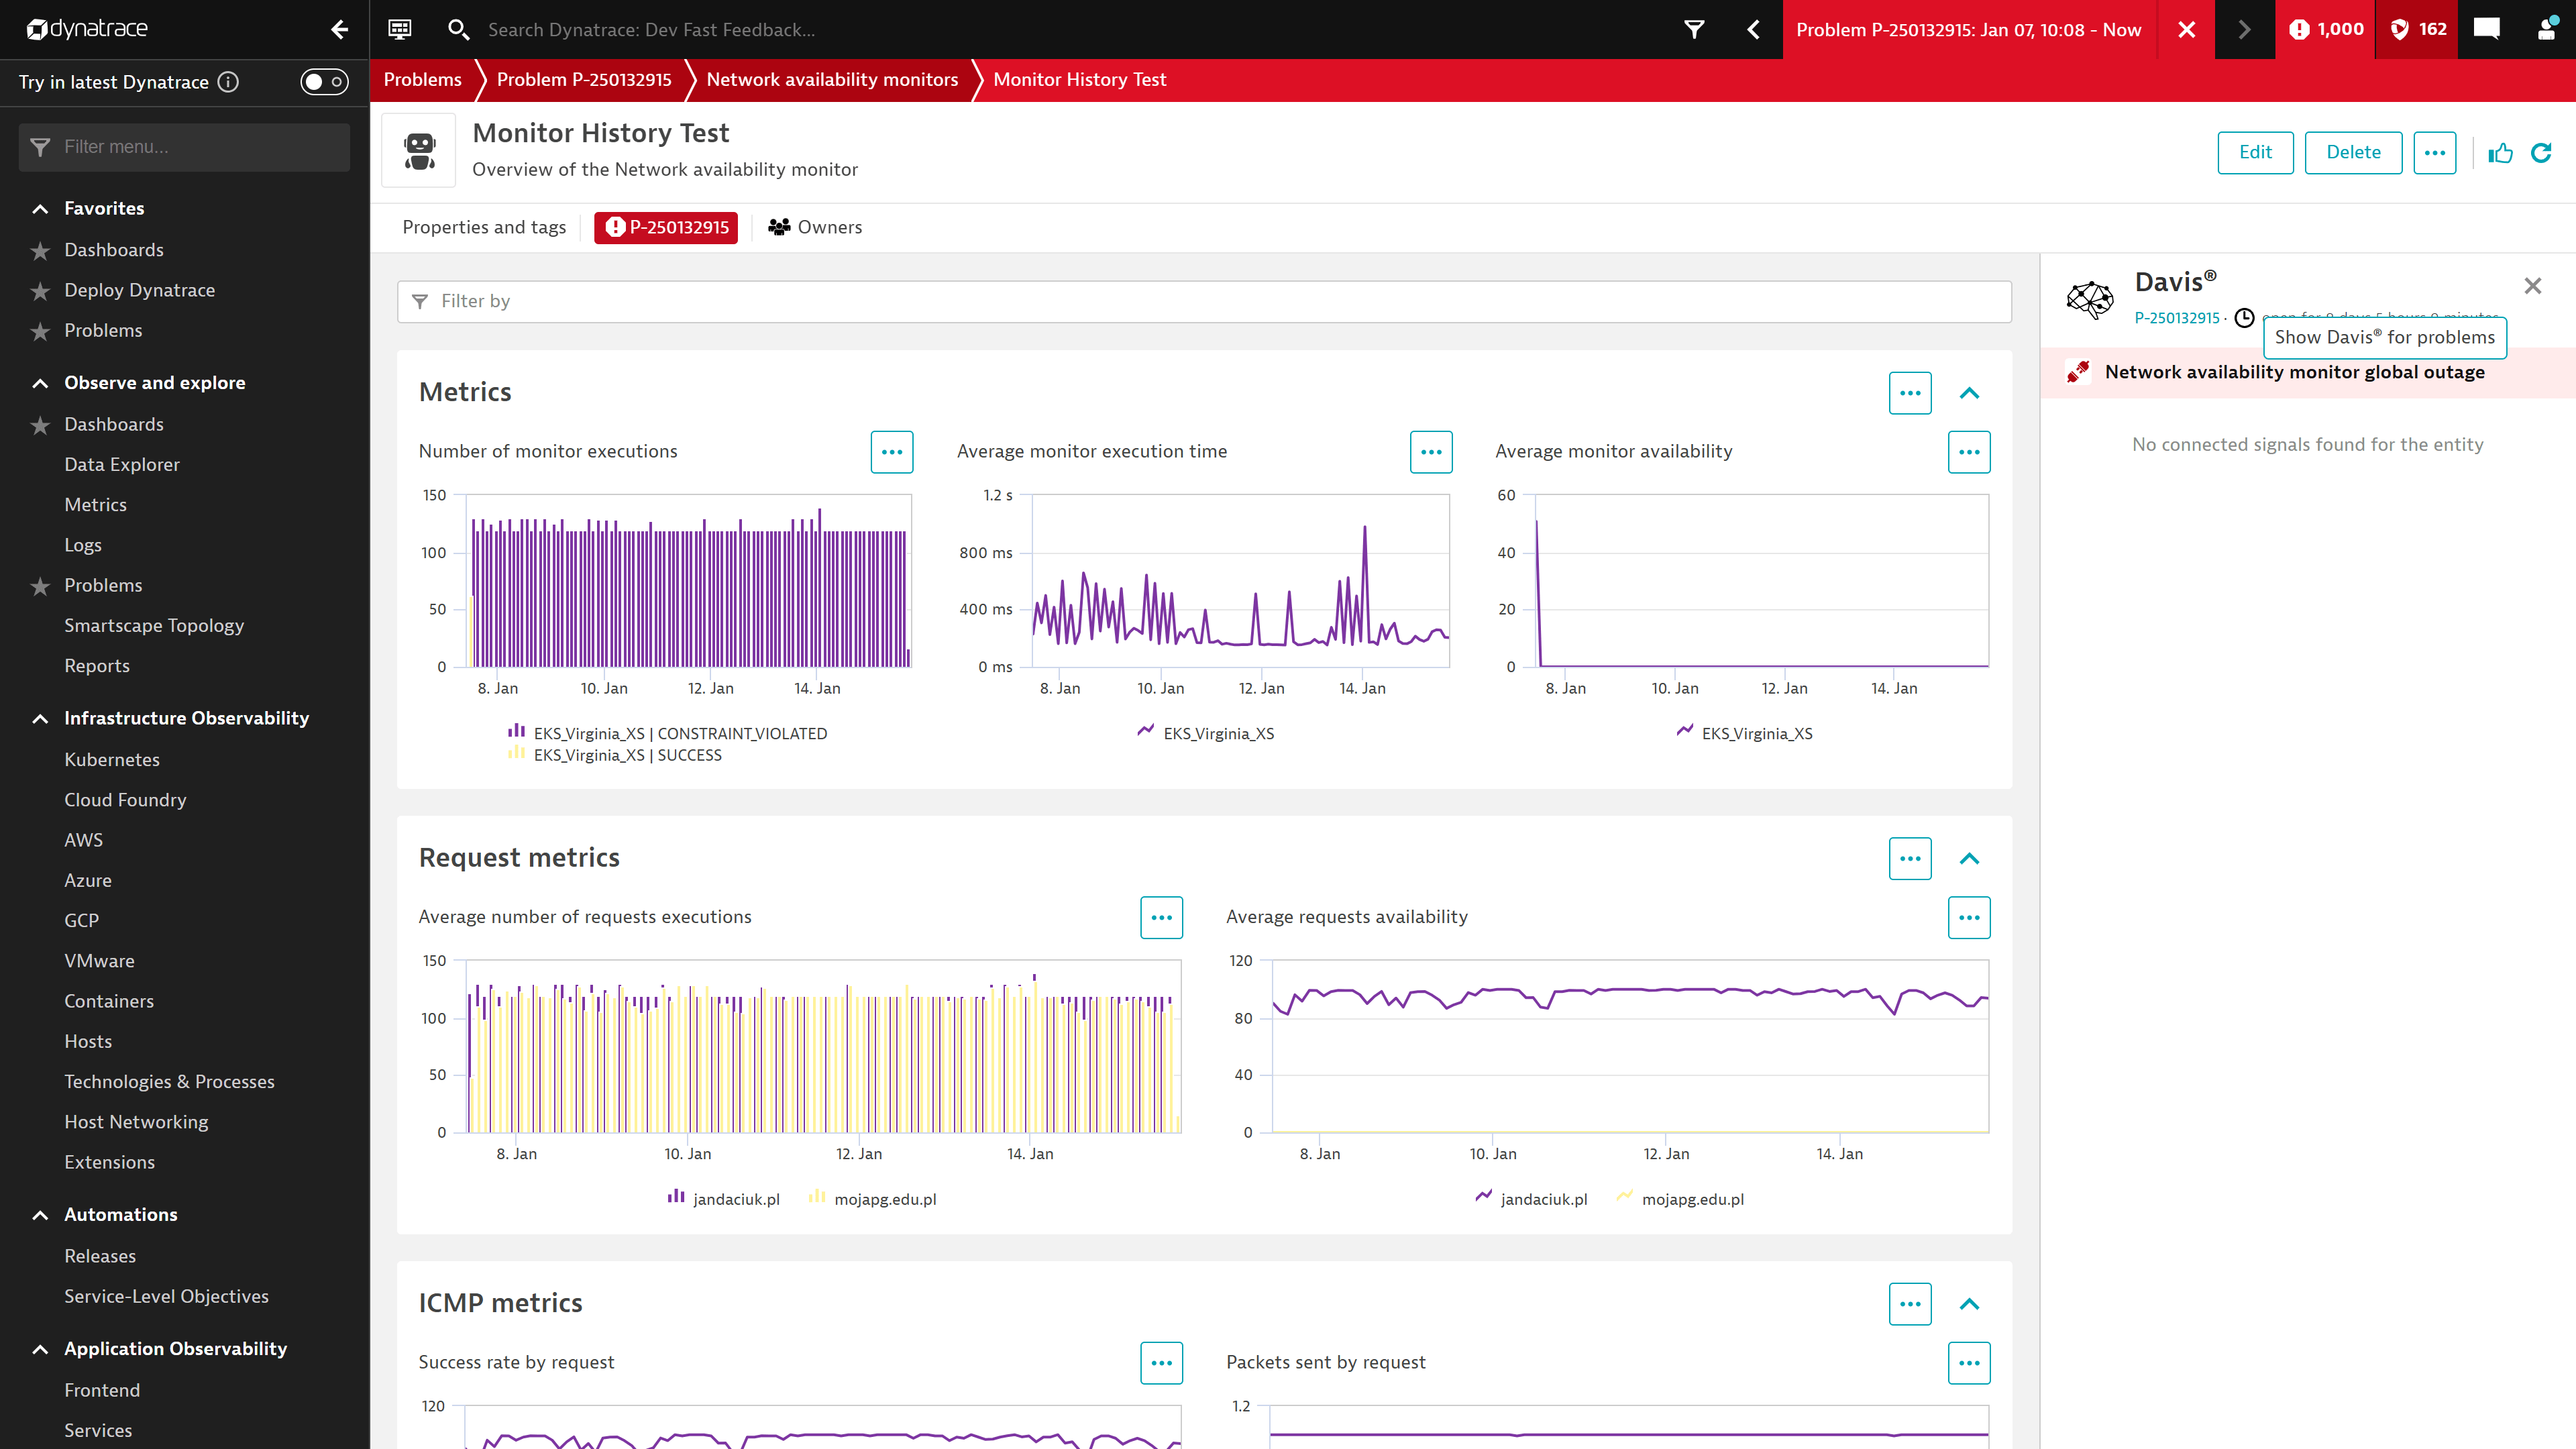
Dynatrace is an AI-powered unified observability and security platform with built-in data observability powered by its Davis AI and Grail lakehouse engine.
Key features
- Leverages the Grail lakehouse engine and Davis AI to track data freshness, distribution, volume, schema changes, lineage, and availability
- Ingests telemetry and observability data without manual configuration, providing causal root-cause and predictive AI-driven insights across logs, metrics, traces, topology, and user behavior.
- Offers flexible per‑usage pricing across modules like full-stack monitoring, infrastructure, security, and real-user monitoring
Best suited for mature enterprise teams seeking a comprehensive, intelligent observability stack that spans applications, infrastructure, and data. Expect significant investment in time and costs before realizing full value.
17. Datadog
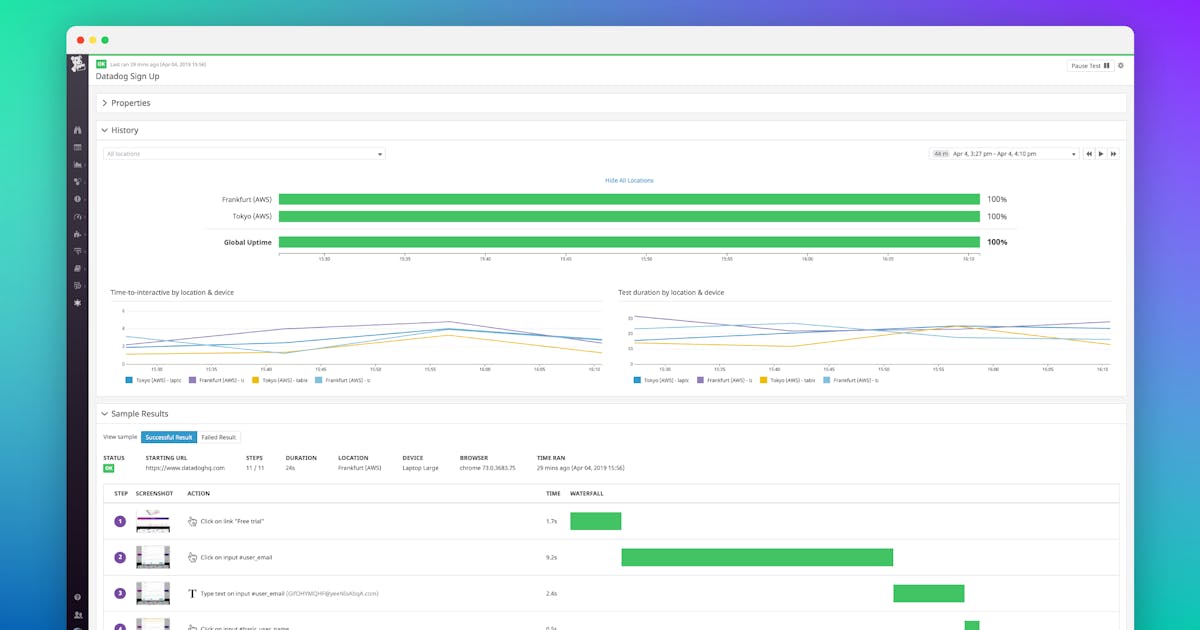
Datadog is a unified full-stack observability platform combining infrastructure monitoring, APM, log analysis, security, and AI-driven insights.
Key features
- Offers unified observability that spans cloud-native architectures, delivering real-time dashboards, alerts, and deep integrations across Kubernetes, serverless, and container environments.
- Bits AI and Watchdog automate root cause analysis, AI model monitoring, and incident resolution across the tech stack.
- Strong integration ecosystem, user-friendly dashboards, and collaborative alerting improve operational visibility and team alignment.
Best suited for teams seeking a powerful, AI‑augmented observability platform that unifies operations, apps, logs, and AI workflows, provided they can manage the budget and tuning complexity.
18. Grafana + Prometheus
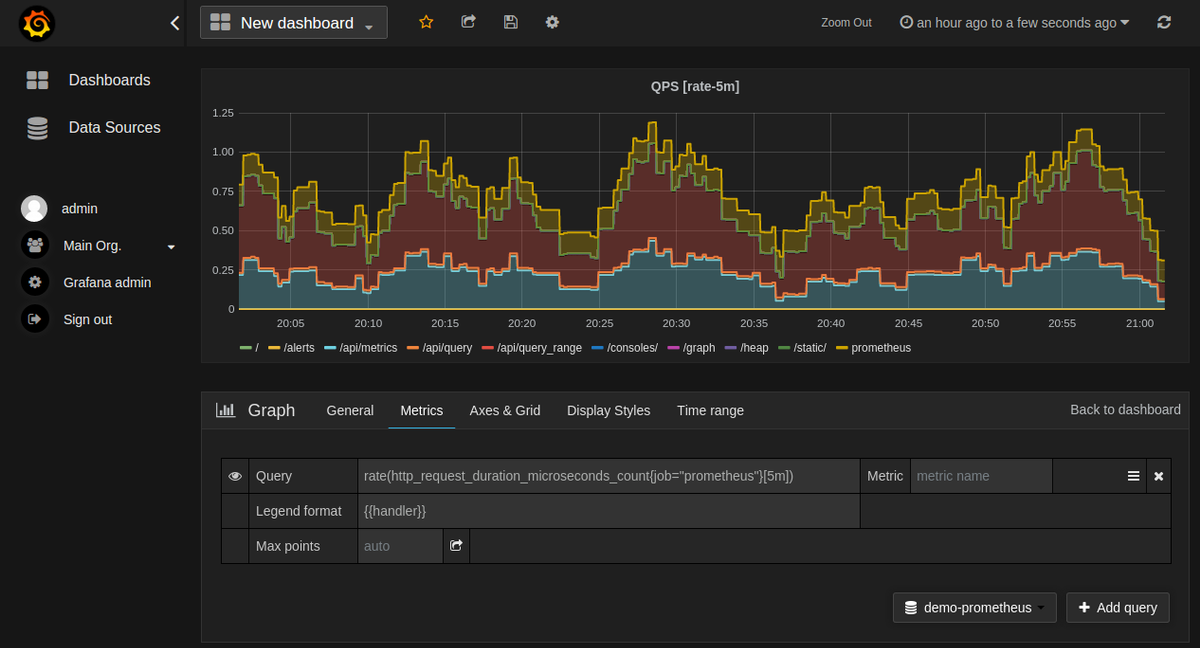
Grafana + Prometheus is a popular open-source observability stack offering flexible metrics collection, alerting, and visualization for engineering and infrastructure teams.
Key features
- Prometheus scrapes and stores time-series metrics using a pull model, with multidimensional labeling and a powerful query language (PromQL)
- Grafana provides real-time dashboards, historical analysis, and alerting via integrations with Prometheus and other backends (e.g., Loki, Tempo, Elasticsearch)
- Highly customizable and extensible via plugins, alert rules, and templated dashboards
- Supports cloud-native environments with native Kubernetes integration, service discovery, and Helm charts for fast deployment
Best suited for DevOps and platform teams needing flexible, infrastructure-focused observability, especially those already using open-source tooling and Kubernetes-native architectures.
19. Elastic Observability

Elastic Observability is an open, AI-enhanced observability solution built on the Elastic Stack to unify logs, metrics, traces, synthetics, APM, and profiling in one platform.
Key features
- Consolidates operational and business telemetry into a unified interface for faster root-cause analysis using ML-powered search and analytics.
- Supports logs, infrastructure, APM, synthetic user monitoring, and profiling
- Offers generative AI observability for LLM applications, plus a fully GA OpenTelemetry ecosystem (EDOT) for seamless telemetry collection.
- Backed by an extensive open-source community, with flexible deployment (self-managed or cloud-managed) and rich integration options.
Best suited for platform and SRE teams that need highly customizable, full-stack observability with advanced AI capabilities.
20. Fluentd
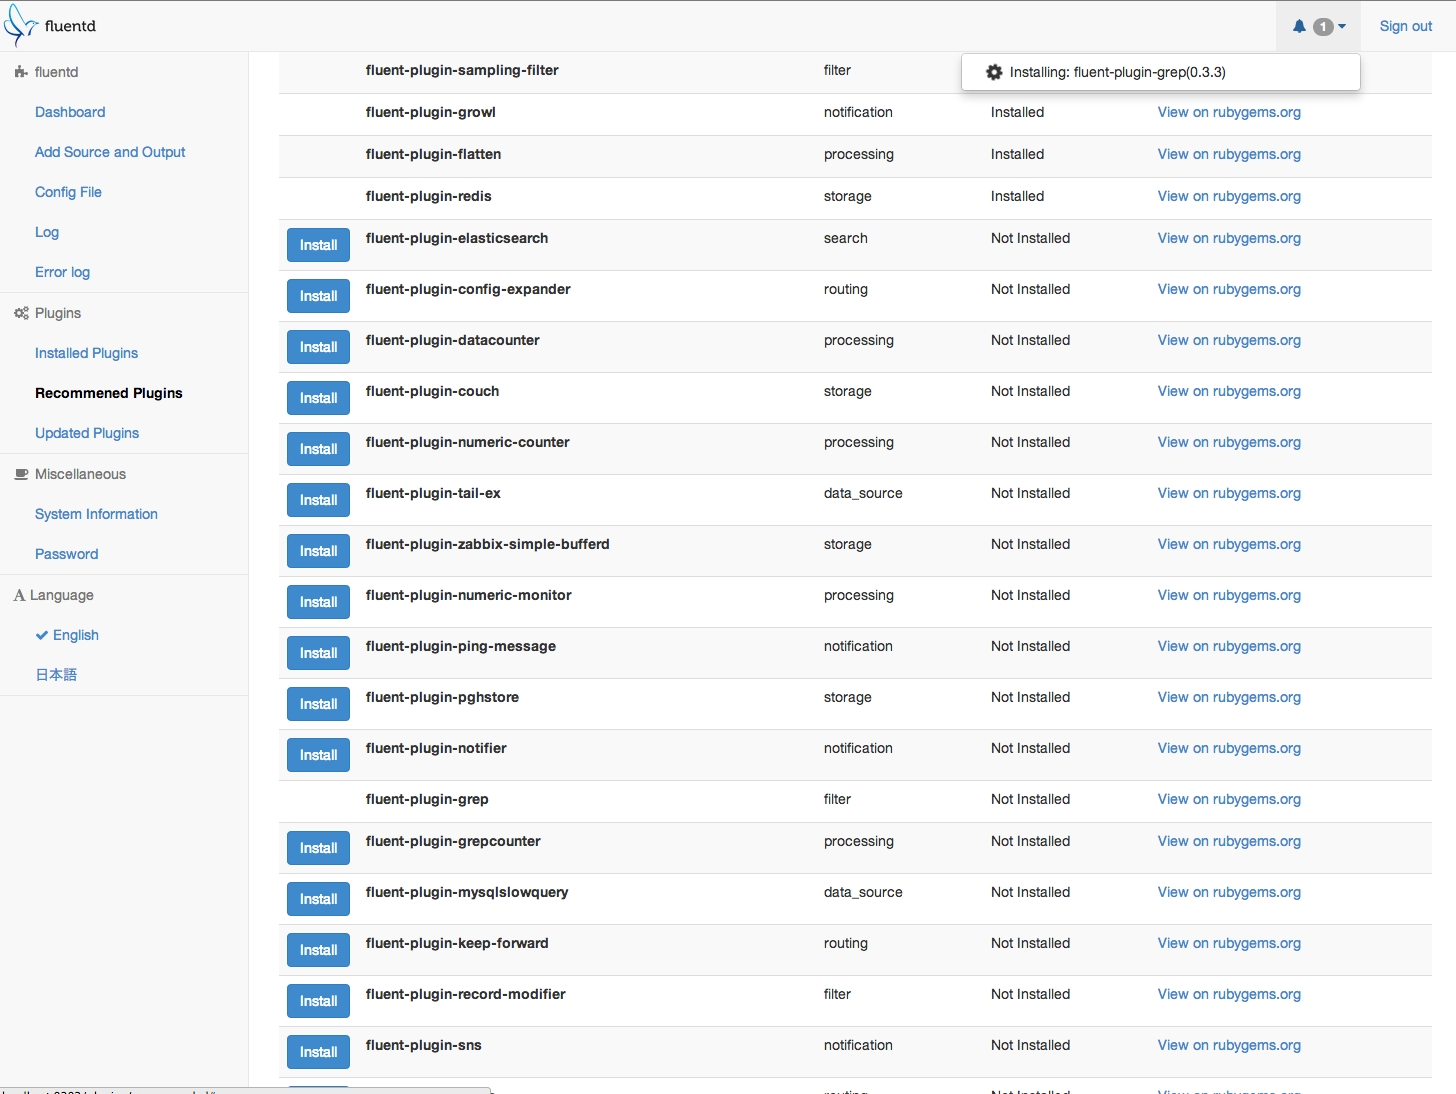
Fluentd is an open-source data collector designed to unify logging pipelines by gathering logs, metrics, and events and routing them to various outputs with structure and consistency.
Key features
- Aggregates unstructured data from diverse sources and standardizes it into structured formats using flexible, plugin-based data parsers and buffers
- Supports over 500 community and enterprise plugins, enabling smooth integration with systems like Elasticsearch, Kafka, S3, and monitoring tools
- Efficient, low overhead design enables processing of high-volume events at scale with buffering and retry capabilities for reliability
Best suited for infrastructure and DevOps teams that need a lightweight, extensible collector for centralized log pipelines.
21. Dagster
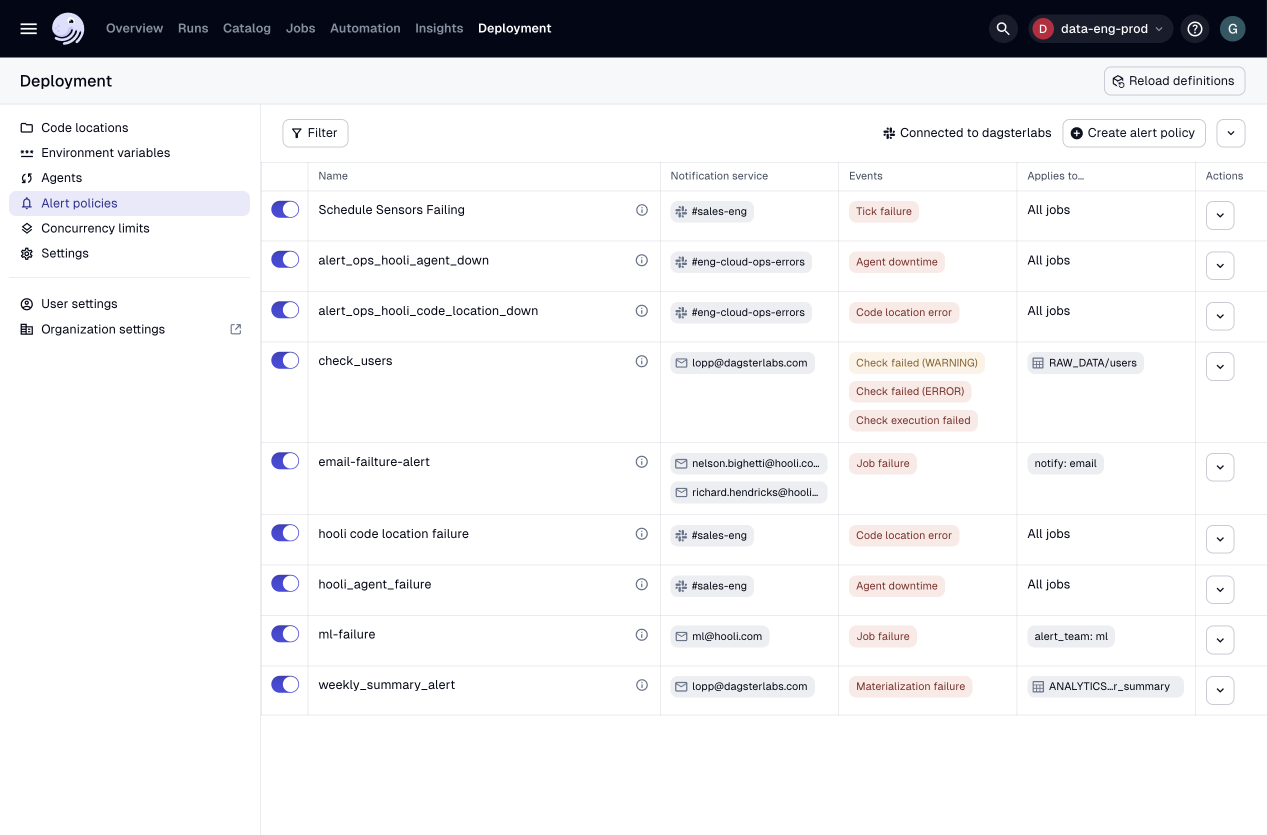
Dagster is a modern, open-source data orchestrator that brings observability and orchestration together in a single platform. While its primary focus is on orchestrating data pipelines, Dagster offers robust observability features that provide deep insights into data workflows.
Key features
- Uses a software-defined asset model (via Python code) to represent data assets and their dependencies, delivering clear lineage and modular pipeline logic
- Offers integrated observability with real‑time asset health dashboards, freshness and success metrics, and Insights-style KPIs for platform-wide monitoring
- Emphasizes developer experience with strong testing support, local development, CI/CD integration, and event-driven execution through schedules and sensors
- Supports broad ecosystem integrations (e.g. dbt, Airflow alternatives, cloud providers, BI tools), and can scale from local environments to full production clusters
Best suited for data engineering teams committed to treating data assets as first-class code constructs and are prepared for the engineering overhead of maintaining a sophisticated orchestration platform.
What challenges can data observability tools help your organization overcome?
Data observability tools address several key challenges that organizations face when managing data at scale. Here are some of the most common issues these tools help mitigate:
1. Detecting data quality issues
Inconsistent, missing, or inaccurate data can lead to flawed analysis and poor decision-making. Data observability tools help organizations automatically detect anomalies such as duplicate records, schema changes, or sudden shifts in data trends, ensuring high data quality and reliability.
2. Reducing downtime and data pipeline failures
Data pipelines are complex, and failures can disrupt business operations. Observability tools provide proactive monitoring, alerting teams to broken pipelines, delayed jobs, or unexpected changes in data flow. This helps organizations quickly resolve issues and minimize downtime.
3. Improving system performance and latency
Slow or inefficient data systems can bottleneck operations and reduce productivity. Observability tools track system performance, identifying latency issues, processing delays, and optimization opportunities to keep data workflows running smoothly.
4. Enhancing compliance and governance
Regulatory requirements demand that organizations maintain data accuracy, security, and auditability. Data observability solutions help track data lineage, detect unauthorized changes, and ensure compliance with data governance policies.
5. Increasing trust in data-driven decision making
When data quality issues go unnoticed, stakeholders lose confidence in analytics and reporting. By continuously monitoring and validating data integrity, observability tools help teams trust their data, leading to more informed and confident decision-making.
Final thoughts
In 2025, choosing the right data observability tool comes down to what your team needs, whether it’s automated data quality monitoring, real-time alerts, lineage tracking, or cost visibility. This list covers the best data observability platforms available today, from flexible open-source options to enterprise-grade solutions. If you’re looking for an all-in-one platform that combines observability with cataloging and governance, try Secoda. It offers end-to-end monitoring, AI-powered insights, and built-in automation to help teams stay ahead of data issues and build trust in their data.
.png)
.png)


